SUBMISSION INSTRUCTIONS
Please send a two-page PDF abstract with unlimited additional figures and a poster draft (max 10MB) to biovis_challenge@ieeevis.org before September 21st 2021, 23:59 PDT. Please also prepare a 5 minute pitch on video at the time. We will send you the instructions to submit this after the original submission.
BioVIS CHALLENGE: “Spatial –omics Visualization”
Recent years have witnessed an explosion in spatial –omics technologies, such as spatial transcriptomics or proteomics. Nature Methods has declared spatial transcriptomics the method of the year [1], recognizing its importance. These -omics methods measure the expressions of tens of proteins to thousands of biomolecules simultaneously and map the corresponding values to spatial positions in tissue. They mostly (especially in proteomics) acquire data at sub-cellular resolution, allowing the identification of individual cells and their interplay in tissue and, as such, offer unprecedented insights into the complex and diverse tissue microenvironment. However, visually exploring spatial data is still a highly challenging task.
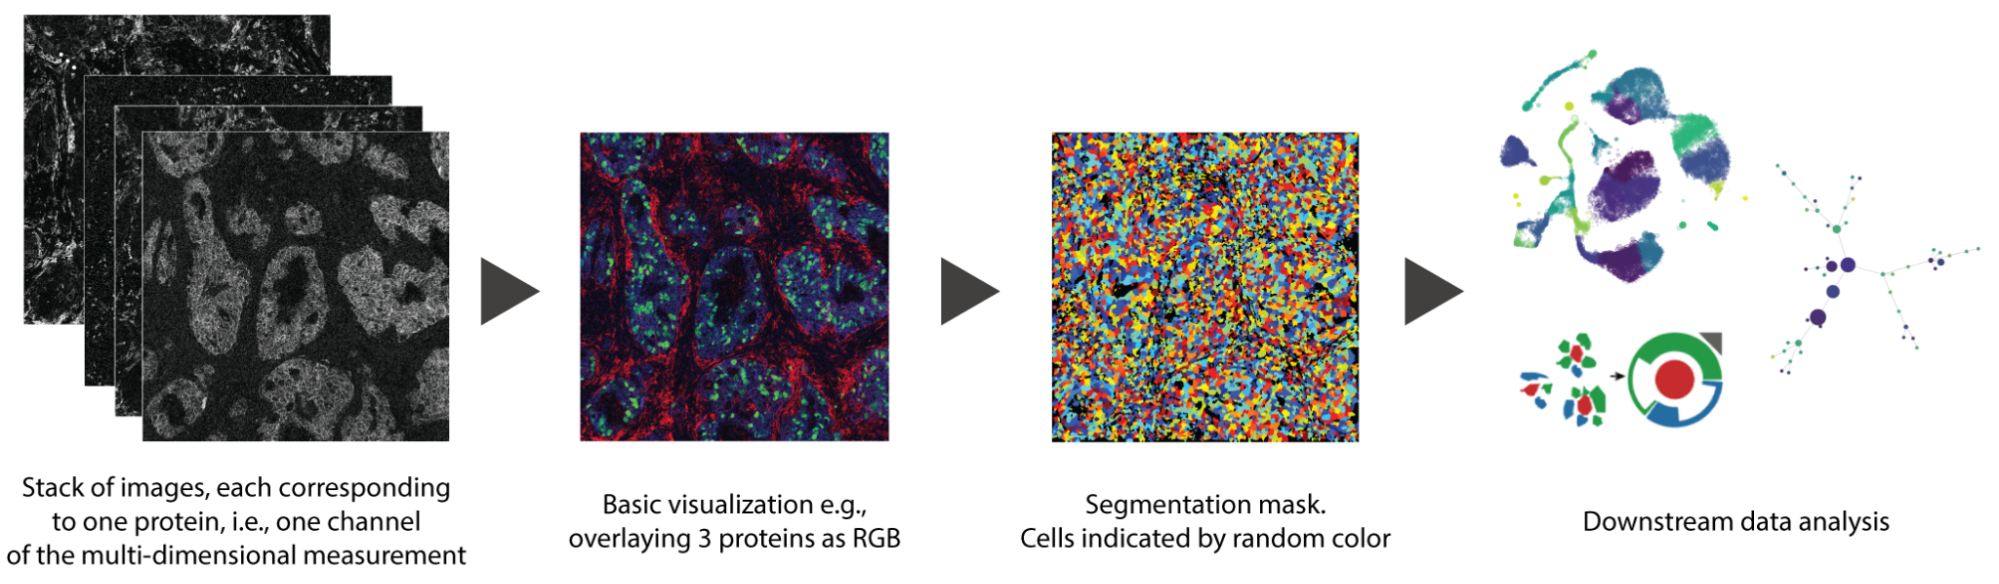
For this year’s BioVis Challenge, we teamed up with cancer biologists from the Leiden University Medical Center, who produced an Imaging Mass Cytometry (IMC) dataset. The dataset includes images from 21 colon cancers classified into four molecular subtypes. Each image is in the order of 1.000 by 1.000 pixels with 40 values (proteins) per pixel. We provide raw image data, segmentation masks of the contained cells, and labels for each cell type.
The BioVis Challenge goal is to visualize spatial patterns in spatial -omics data using either the dataset provided, OR other similar spatial -omics data you are working on. The appropriate patterns can include: i) cell colocalization; ii) protein/gene distribution within the samples or on co-localized cells; or iii) others of your choice! Based on different data facets, different approaches are possible. You can use one data facet or any combination!
CHALLENGE TASKS
Here are some potential challenges you can address in visualizing the provided data. We invite submissions tackling any number of these or other problems!
-
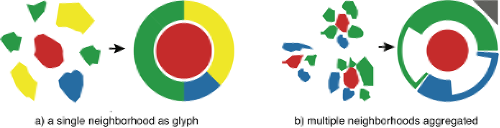
Visualize common cell co-localization patterns based on segmented cells and their labels. e.g. You can use a simple glyph to aggregate common motifs in a small multiples view (Somarakis et al. [2]).
-
Identify and visualize sample-specific cell neighborhoods based on segmented cells and their labels. Special care is needed for neighborhoods that (i) are sample-specific, consisting of cell types that are unique to, or more prevalent at that sample and (ii) include rare cell types which are often drowned out by neighborhoods of predominant types in that sample.
-
Visualize distinct protein distribution patterns within different cells by using segmented cells and labels as well as visualizing the pixel data. (i) Can you identify communicating cells through different protein distributions at the boundary? (ii) Can the labels be refined based on this spatial information?
-
Can you visualize the data effectively with a segmentation free approach by using the pixel data only? Can this provide more insight into spatial patterns than segmented data?
-
Can you improve segmentation masks using pixel data of all dimensions? Segmentation masks are usually based on a few dimensions; maybe cells can be segmented/visualized better by using all, or a selected set of dimensions of the raw pixel data.
Dataset
- Real data on 22 colorectal cancers classified into 4 molecular subtypes, with up to 3 samples per cancer (60 samples total), generated by IMC. 39 proteins were measured simultaneously. Each pixel covers an area of 1µm2.
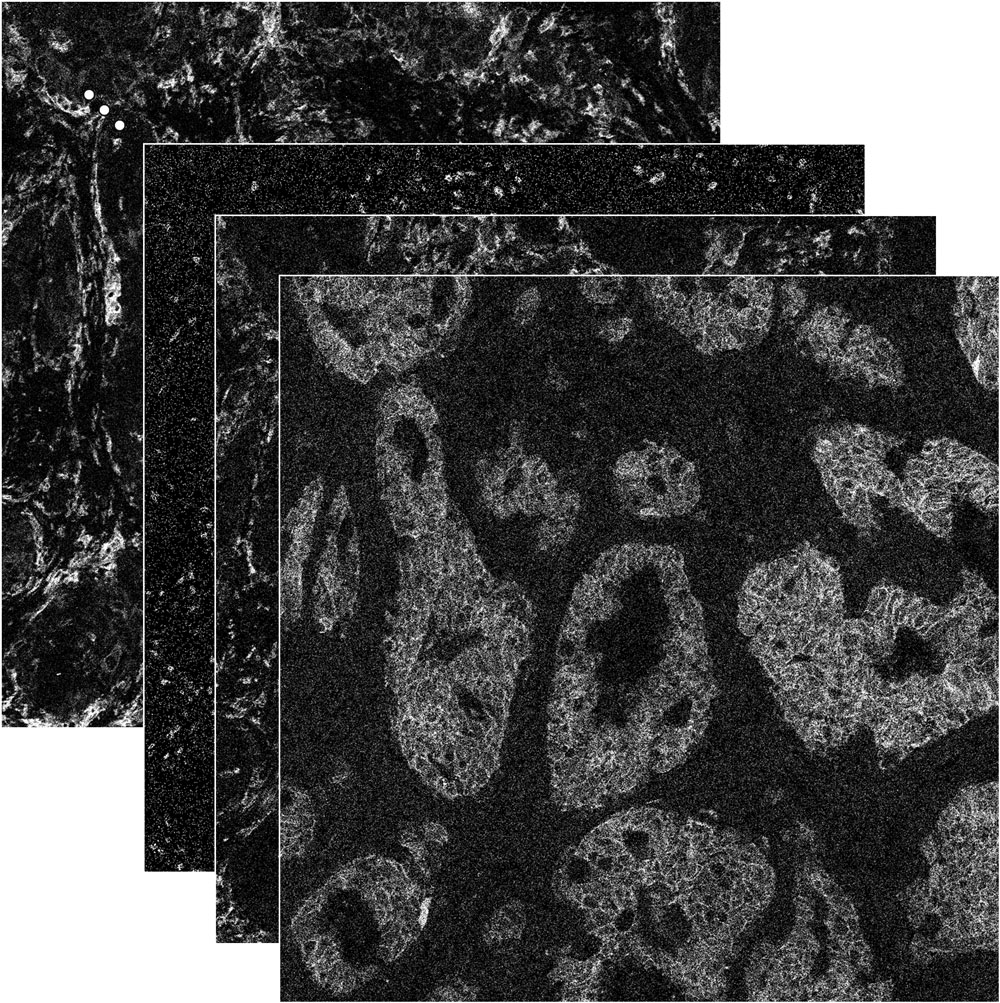
- Raw pixel data as tiff images, where every image is an 8 bit grayscale encoding the measured expression of one protein. Additionally, we provide a binarized version of the data following a protocol in [3] in the same structure.
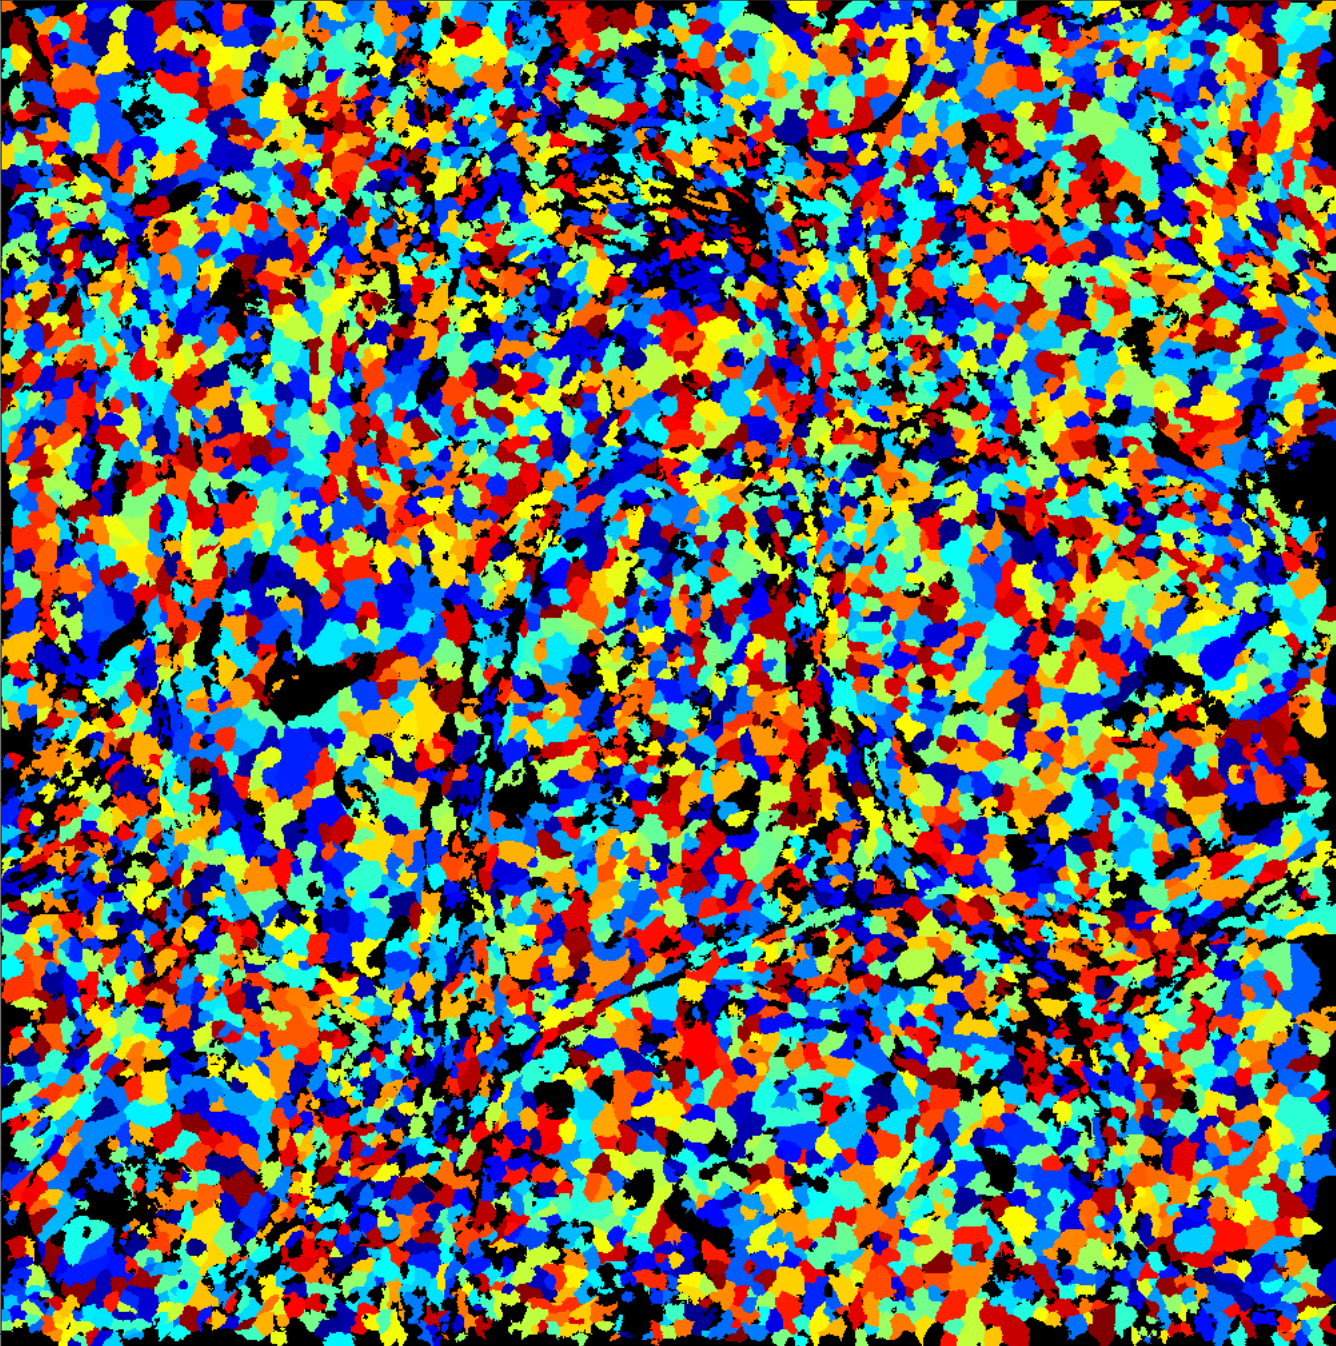
- Segmentation masks as 32 bit tiff image files, where all pixels assigned to a cell are inscribed with a unique integer id.
- Protein measurements aggregated per cell, according to the above segmentation.
- Cell labels table that assigns a cell type label to every cell id from the segmentation masks.
The complete dataset can be downloaded here.
Disclaimer: The provided dataset is currently not published and is provided for the purpose of this BioVis Challenge only. It must not be used for other publications until after the challenge is concluded and presented at the BioVis Challenge workshop @ IEEE Vis 2021 (25 October 2021).
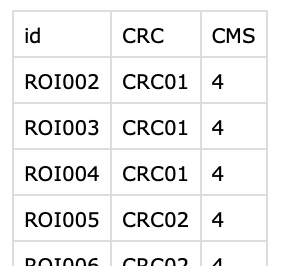
| sample_ROI_information.csv |
Information on each sample. id: sample name CRC: patient/cancer signifier (multiple samples per cancer) CMS: cancer molecular subtype |
 |
| cell_labels/ROIXXX_cell_labels.csv |
One csv file per sample. Each file contains a single column, with each row number corresponding to a cell ID in segmentation_mask.tiff. Each row contains the cell type label for the corresponding cell in the sample. The labels can be used for example to work directly on cell-based neighborhood visualizations, without using protein information. |
 |
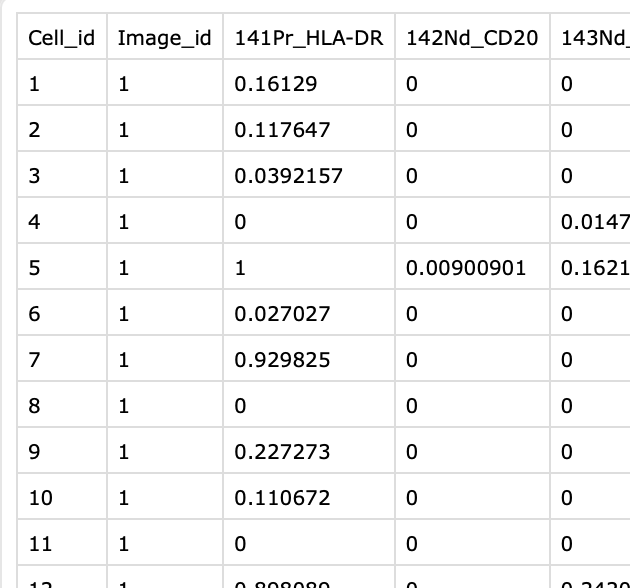
| aggregated_intensities/ ROIXXX_aggregated_intensities.csv |
One csv file per sample. Each file contains pixel fraction per cell that expresses each measured protein, based on data thresholds. Last few columns contain some morphological features. Cell_id column corresponds to those from segmentation_mask.tiff. Image_id column can be ignored. |
 |
| ROIs folder |
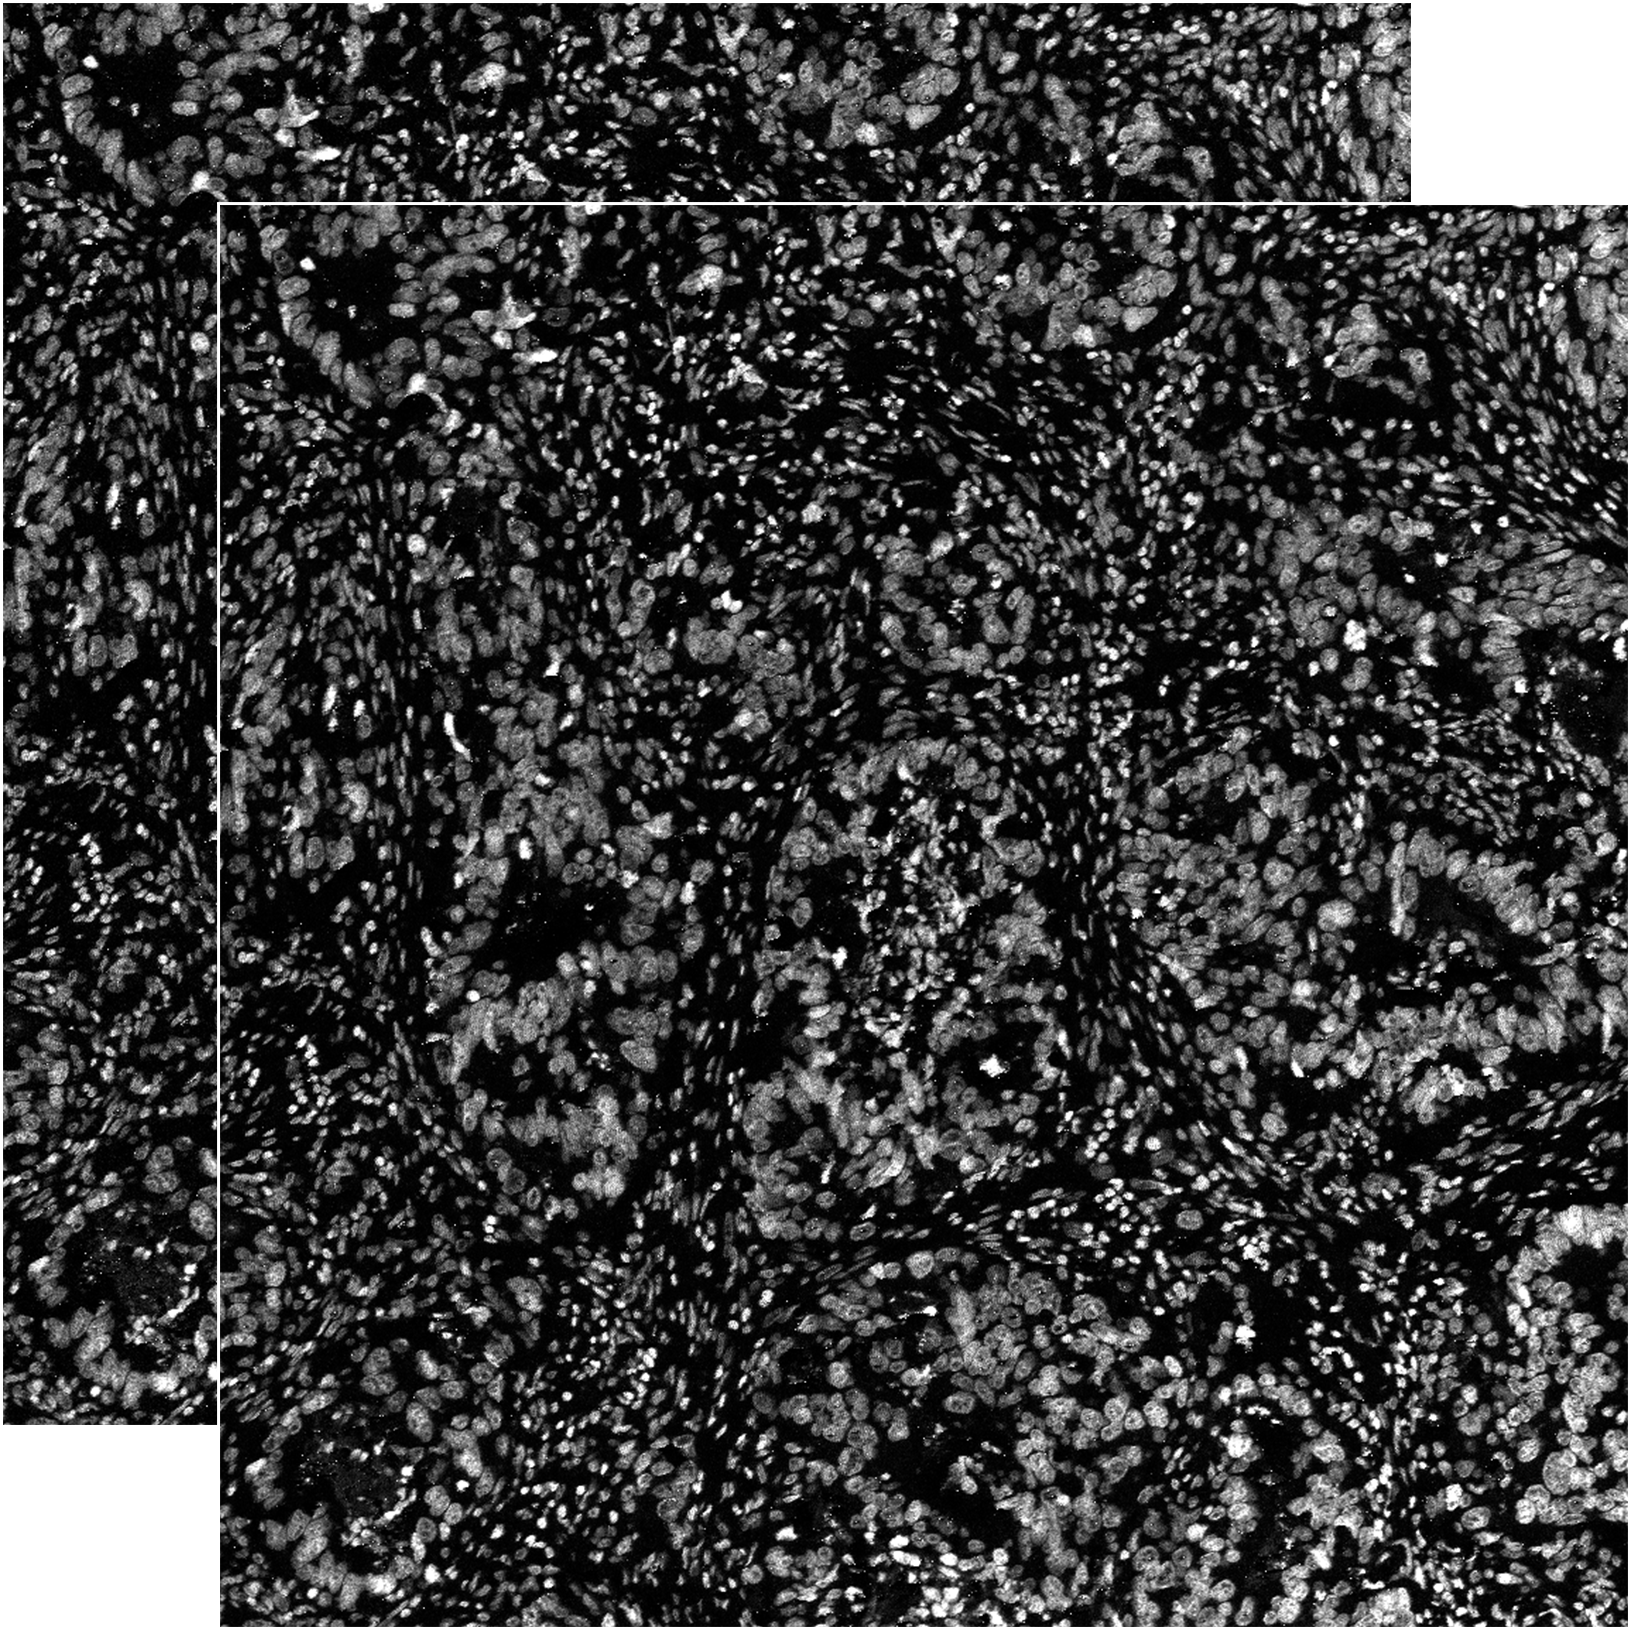
Contains subfolders for each sample in sample_ROI_information.csv. Additionally DNA expression is provided in DNA1.tiff and DNA2.tiff. DNA might be useful for segmentation tasks but are not relevant for cell type identification, hence we provide them separately. |
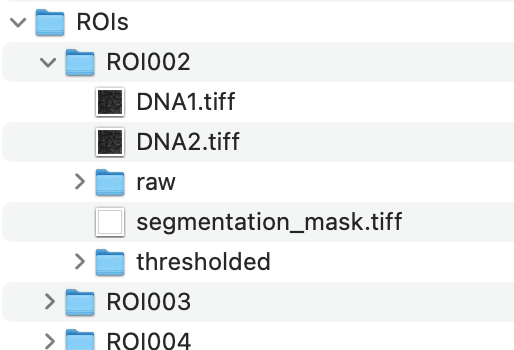 |
| raw and thresholded folders |
The raw and thresholded folders contain the sample images. The 39 measured proteins are saved in individual .tiff files which will be combined for multi-dimensional analysis. Filenames are named after their protein. All images are 8bit grayscale .tiff |
 |
| DNA1.tiff DNA2.tiff |
Raw DNA measurements that might be useful for segmentation tasks but are not relevant for cell type identification, hence we provide them separately. Images are 8bit grayscale .tiff |
 |
| segmentation_mask.tiff |
IMC cell segmentation following the pipeline from Bodenmiller: https://github.com/BodenmillerGroup/ImcSegmentationPipeline Segmentation is provided as a 32bit single-channel tiff image, where each cell is labelled with a unique 32 bit integer (starting at 1!). For illustration on the right, we assigned a random color to each unique number (cell). |
 |
[1] Marx, V. Method of the Year: spatially resolved transcriptomics. Nature Methods 18, 9–14 (2021). https://doi.org/10.1038/s41592-020-01033-y
[2] Somarakis, A. et al., ImaCytE: Visual Exploration of Cellular Microenvironments for Imaging Mass Cytometry Data. IEEE Transactions on Visualization and Computer Graphics, 27(1): pp. 98–110, 2021. https://doi.org/10.1109/TVCG.2019.2931299
[3] Ijsselsteijn, M.E. et al., Semi-Automated Background Removal Limits Loss of Data and Normalises the Images for Downstream Analysis of Imaging Mass Cytometry Data. bioRxiv, 2020. https://dx.doi.org/10.1101/2020.11.26.399717