Visual exploration of mammography dataset
OMAMA-DB is a large public mammography dataset designed to support research in breast cancer screening, medical image analysis, and machine learning. It combines 2D full-field digital mammography (FFDM) images and 3D digital breast tomosynthesis (DBT) volumes, together with pathology-based cancer labels and automated lesion annotations. The dataset was created to address a major gap in the field: while mammography is one of the most important tools for early breast cancer detection, publicly accessible datasets are often either too small, incomplete, or difficult to obtain for broad computational research. OMAMA-DB was introduced to provide a large-scale, curated resource that can be used both for algorithm development and for visual analytics research. The attached paper describing the dataset will soon appear as:
Kanamarlapudi, A., Zurrin, R., Gaibor, E., Bendiksen Gutierrez, B., Goyal, N., Narayanappa, V. S., Simovici, D., Haspel, N., Pomplun, M., Lee, H., Bandler, M., Sorensen, G., & Haehn, D. OMAMA-DB: The Oregon–Massachusetts Mammography Database. Journal of Medical Imaging (JMI), 2026.
Starting from an institutional collection of 967,991 images, the creators of OMAMA-DB applied a multi-stage curation pipeline to remove images with missing labels, uncommon dimensions, rare scanner types, duplicate studies, corrupted files, and low-quality outliers. The final curated dataset contains 231,080 images in total, including 163,568 2D mammograms and 67,512 3D tomosynthesis volumes. It includes 7,351 cancer cases in the 2D subset and 374 cancer cases in the 3D subset, making it one of the largest publicly available datasets of its kind.
The 2D subset is available in multiple resolutions for rapid prototyping and training, while the 3D subset is provided separately due to its large size. Each image is stored in compressed NumPy format and paired with a JSON metadata file. The dataset is hosted on Harvard Dataverse, with separate persistent identifiers for the 2D and 3D subsets.
Metadata
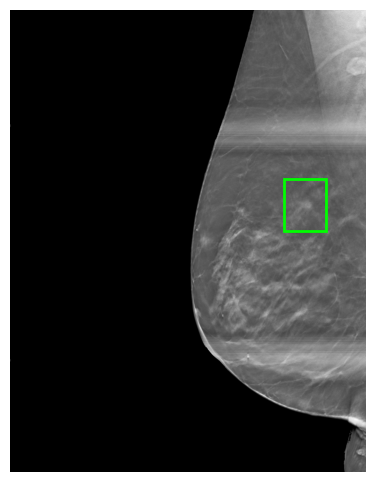
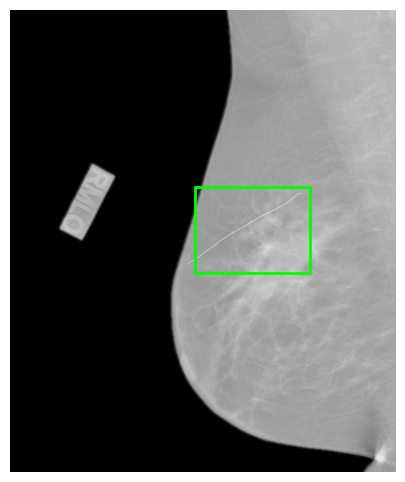
Each image in OMAMA-DB is accompanied by structured JSON metadata. This metadata includes patient and acquisition information such as mammographic view, laterality, pixel spacing, and display window settings, as well as lesion information in the form of bounding box coordinates, confidence scores, and pathology-derived labels. The dataset includes the four standard mammography screening views: left and right craniocaudal (CC) and left and right mediolateral oblique (MLO). It is relatively balanced across view types and laterality, and it includes both 2D and 3D modalities, which makes it especially suitable for comparative analysis and visualization tasks.
A key component of the dataset is the automated cancer lesion annotation generated with DeepSight, a research version of the FDA-cleared Saige-Dx system. For each image, DeepSight detects suspicious regions and produces bounding boxes with confidence scores indicating the likelihood of malignancy. These annotations are stored as JSON metadata alongside the images.
Below is an outline of the metadata content:
- PatientID: A unique identifier for the patient associated with the image.
- View: The mammographic view (e.g., cranio-caudal) that the image represents.
- WindowCenter: An array indicating the center pixel values used for windowing the image, which affects image brightness. Multiple values represent different window settings.
- WindowWidth: An array indicating the width of the windowing range, which affects the contrast of the image. Multiple values correspond to the center values for different contrast settings.
- WindowCenterWidthExplanation: Descriptions corresponding to the ‘WindowCenter’ and ‘WindowWidth’ settings, which may indicate standard or altered viewing conditions like ‘NORMAL’, ‘HARDER’, or ‘SOFTER’.
- ImagerPixelSpacing: The physical distance covered by each pixel in the image, specified in millimeters (e.g., [0.1, 0.1] would mean each pixel represents a 0.1mm by 0.1mm area).
- ImageLaterality: The side of the body that the image represents, ‘R’ for right and ‘L’ for left.
- Coords: The coordinates of the region of interest within the image, typically representing a bounding box around a lesion or area of interest (format: [x1, y1, x2, y2]). For 3D, there is a ‘Slice’ key which indicates where the 2D ROI is placed.
- Score: A confidence score (ranging from 0 to 1) indicating the likelihood of the presence of a lesion or other significant feature within the region of interest.
- Label: The cancer classification of the image.
2D Dataset Statistics
- Image Count: 165368
- Patient Count: 157810
- Cancer Count: 7351
- Deepsight Valid Score: 4371
- CC Count: 83379
- MLO Count: 80163
- L Count: 81523
- R Count: 82045
3D Dataset Details
- Image Count: 67,512
- Patient Count: 15,149
- Cancer Count: 374
- Deepsight Valid Score: 270
- CC Count: 32,621
- MLO Count: 32,900
- L Count: 33,892
- R Count: 33,620
Tasks
While OMAMA-DB provides a rich and large-scale collection of mammography images together with metadata, pathology labels, and automated lesion annotations, current analysis workflows are typically limited to model training, quantitative evaluation, or inspection of individual cases. There is a strong need for visual analytics approaches that support understanding this dataset at scale while still enabling detailed inspection.
We thus challenge you to address one or multiple of the following tasks:
-
T1: Identify artifacts, low-quality images, and outliers. The dataset was curated using multiple filtering stages, including automated outlier detection. However, artifacts, acquisition inconsistencies, and unusual intensity patterns may still be present. Develop visualization and interaction techniques that help identify, characterize, and explore such outliers across the dataset. For example, can systematic quality issues related to scanners, acquisition settings, or image types be detected and revealed?
-
T2: Compare automated annotations with pathology-based labels. Each image includes pathology-derived labels (NonCancer, PreIndexCancer, IndexCancer) as well as automated lesion annotations with confidence scores. Design approaches that help analyze the relationship between these sources of information. For example, can discrepancies between annotation confidence and ground truth be identified and explained? Can visualization support the detection of false positives, false negatives, or uncertain cases?
-
T3: Explore structure across image types and acquisition context. OMAMA-DB includes multiple modalities and standardized views (CC vs. MLO, left vs. right, 2D vs. 3D). Develop methods to reveal patterns, similarities, and differences across these categories. For example, can participants identify clusters of images with similar characteristics or uncover systematic differences between modalities or views?
-
T4: Design a generic visual analytics approach for image + metadata + AI labels. The dataset combines high-dimensional image data with structured metadata and automatically generated annotations. We encourage participants to propose general-purpose visual analytics solutions that integrate these components. The goal is to support both overview and detailed exploration, enabling users to navigate between dataset-level patterns and individual cases, and to better understand the behavior and limitations of AI-based labeling methods.
Dataset
The full dataset can be found here: https://dataverse.harvard.edu/dataverse/omama.
Follow these instructions to access the data.
For a glance at a sample data, you can check out this notebook.
Related Work
Lekschas, Fritz, Xinyi Zhou, Wei Chen, Nils Gehlenborg, Benjamin Bach, and Hanspeter Pfister. “A generic framework and library for exploration of small multiples through interactive piling.” IEEE Transactions on Visualization and Computer Graphics 27, no. 2 (2020): 358-368. https://doi.org/10.1109/TVCG.2020.3028948
Questions?
Please feel free to send any questions to: biovis_challenge@ieeevis.org.
Chairs of the Bio+MedVis Challenge @ IEEE VIS 2026:
- Katarina Furmanova, Masaryk University, Czech Republic
- Daniel Haehn, University of Massachusetts Boston, USA
- Robert Krueger, New York University, USA