Co2Vis: A visual analytics tool for mining co-expressed and co-regulated genes implied in HIV infections
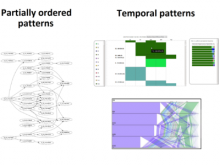
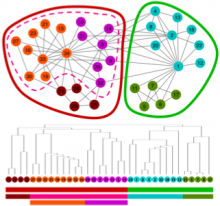
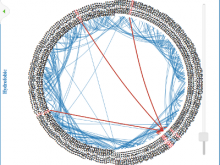
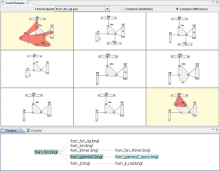
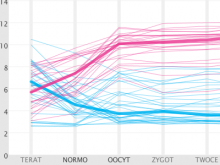
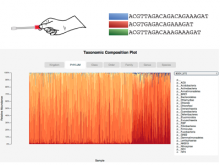
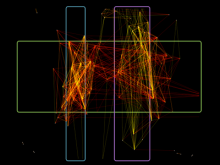
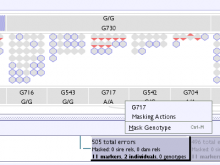
One of the key challenges in human health is the identification of disease-causing genes like AIDS (Acquired ImmunoDeficiency Syndrome). Numerous studies have addressed this challenge through gene expression analysis. Due to the amount of data available, processing DNA microarrays in a way that makes biomedical sense is still a major issue. Statistical methods and data mining techniques play a key role in discovering previously unknown knowledge. However, applying such techniques in this context is difficult because the number of measurement points (i.e., gene expression levels) is much higher than the number of samples resulting in the well-known curse of dimensionality problem also called the high feature-to-sample ratio. In this study, temporal changes of the expression levels of about 19,000 genes on three HIV strains (HIV-2, HIV-1 : X4 and R5), were evaluated at 04h, 08h, 24h, 48h and 72h after infections. We propose a combination of data mining and visual analytics methods to identify and render to experts co-expressed and co-regulated genes implied in HIV infections. Our process is divided into 4 steps: 1- Data pre-processing, 2- Gene patterns extraction based on trajectories (co-expressed genes over time) and partial order patterns (co-regulated genes), 3- Annotation of patterns with biological functions by using GeneOntology, 4- Visualization to help user access the results based on previous steps (based on DAG drawing methods, parallel sets visualization and interactive graphic charts). Experiments on real data have shown the efficiency of this preliminary method.
BioVis 2013 Information