Focus+Context Visualization for Computational Biology Expression Atlases
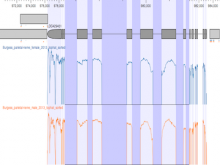
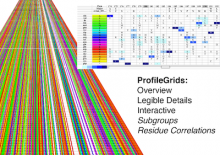
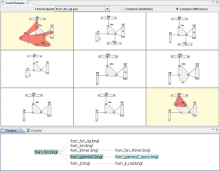
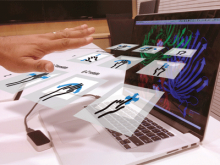
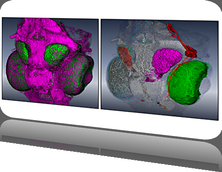
We present our work-in-progress examining novel methods for the visual analysis of genomic expression atlases. Understanding the molecular basis for regulating key biological processes such as transcription, translation, and genetic variation is vital. A gene expression atlas provides information about when and where such products are expressed. These atlases are very large - the bovine atlas contains 7.2 million unique 20 base transcript tags profiled from 81 tissues - making analysis difficult. In addition, current tools are cumbersome and do not facilitate cross-tissue or similar comparison. Our focus+context method allows multiple side-by-side comparisons while providing context for other regions of expression. Each expression track is displayed with the genome and may be zoomed in for finer detail; a comparison tool allows for more exact examination between tracks. Neighboring genes are displayed in reduced detail with markers indicating expression levels of interest; these can be quickly navigated to via clicking or selection via a context-aware search. Based upon feedback from our biologist colleagues, we are adding statistical summary comparison tracks and multi-chromosomal analysis. The interface is completely web-based for easy deployment.
BioVis 2013 Information