ProfileGrids Visualize Protein Mutation Distributions
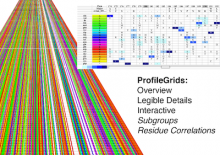
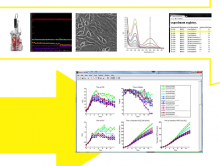
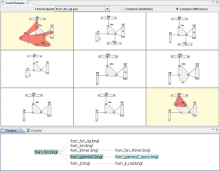
Large multiple sequence alignments (MSAs) are no longer manageable for visualization using the traditional stacked sequence alignment representation. Sequence Logos were introduced in 1990 to represent a MSA consensus; and, there have been no significant advances in alignment visualization since then. However, Logos are inadequate for visualizing protein MSAs. For example, alignment variable regions and rare residues are not legible. Also, there is no visual encoding of differences between data sets other than the stacking of separate Logos. ProfileGrids are a new paradigm for visualizing large MSAs as a matrix color-coded according to the residue frequency occurring at each column position (http://www.biomedcentral.com/1471-2105/9/554/). Our poster will discuss the criteria for MSA visualization paradigms and tools. Procter (2010) suggested that tools should navigate visually both an overview and the details of an alignment while having mechanisms to query annotated data. JProfileGrid accomplishes these tasks and also satisfies new criteria for "solving" the large alignment visualization challenge such as depicting specific subgroups of an alignment (using a new metadata feature) as well as showing correlations between amino acid positions within subgroups (by treating an alignment as a database for lookups). Finally, the 2013 BioVis Redesign Contest allows comparing Sequence Logos versus ProfileGrids on the same dataset as judged by visualization and protein family experts. We demonstrate that ProfileGrids clearly visualize protein mutation distributions and differences between subfamily alignments. The new JProfileGrid v2.0 software (http://f1000research.com/articles/2-2/) is freely available (http://www.ProfileGrid.org).
BioVis 2013 Information