SAVoR: Annotation and Visualization of RNA structures
Poster
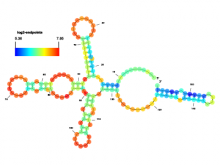
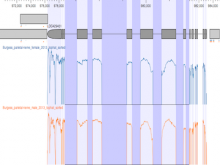
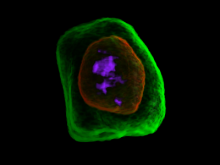
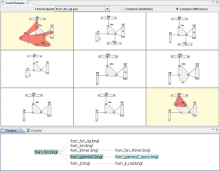
The Sequencing Annotation and Visualization of RNA structures (SAVoR) web server links RNA structure predictions with sequencing data and genomic annotations to produce highly informative and annotated models of RNA secondary structure. SAVoR accepts read alignment data from RNA-seq experiments, computes a series of per-base values such as read abundance and sequence variant frequency, and then projects these values onto a customizable secondary structure model. Here, we present recent updates to SAVoR that include additional modes of annotation, structure prediction, and visualization, as well as an improved user interface and batch mode option.
BioVis 2013 Information