Visual analysis of zygotic and early embryonic transcripts
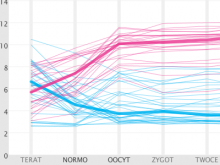
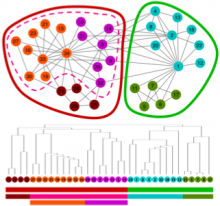
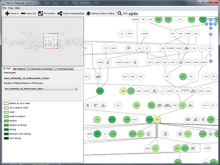
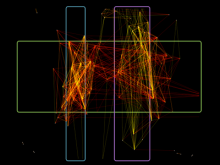
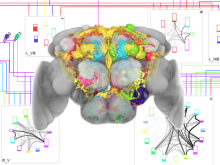
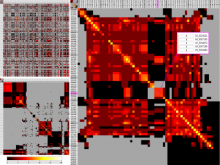
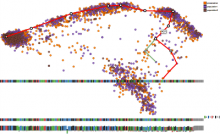
Integration of heterogeneous datasets to infer important relationships and patterns while considering the noisiness of that data is one of the important challenges accompanying modern biology. We present a design study where an effective visual encoding of data developed through successive iterations catalyzed efficient communication and collaboration among scientific domain experts, the machine learning expert and the visualization researcher. To study expression levels and 3'UTR length difference of transcripts at different stages of embryogenesis, data from multi-tissue Affymetrix oligo-probe expression experiments were submitted to self-organizing map (SOM) clustering of transcripts and analysis of covariance (ANCOVA) between two tissues. External datasets, such as gene ontology (GO) terms from Ensembl BioMart and Kegg pathway terms from Gene Set Enrichment Analysis (GSEA), were also integrated for functional annotation. This interactive visualization consists of multiple panels, including parallel coordinates, a scatter plot and a graph visualization of SOM clustering outputs. The interface provides focus-plus-context interactions to enable users to identify the cluster of interest and to examine individual transcripts within the selected cluster. This tool enabled the domain experts to advance the characterization of transcripts from various tissues and to develop a bioinformatics pipeline for analysis. This tool was developed in a highly flexible, rapid prototyping software development methodology to incorporate visual analysis into every step of data exploration and testing hypotheses, resulting a close feedback loop between the experts and the visualization researcher.
BioVis 2013 Information
