Visual Comparison and Investigation of Cancer Data using a Deterministic Graph Layout
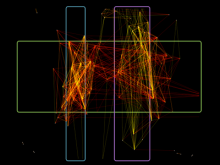
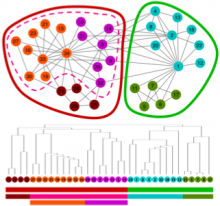
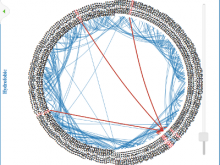
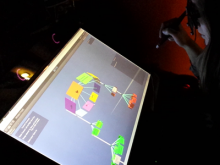
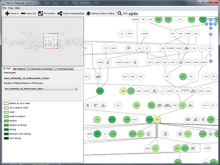
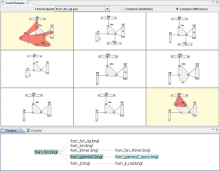
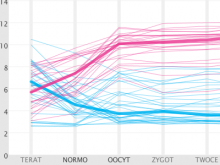
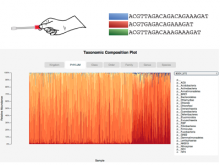
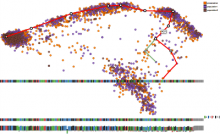
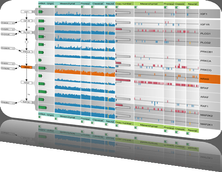
Large cancer datasets from projects such as The Cancer Genome Atlas consist of complex sets of heterogeneous data types. Thousands of samples have been collected, each including information about molecular measurements, genomic aberrations, histology data, and clinical information. Identifying the associations in this data provides insight into the nature of a disease. Multivariate analysis of a single tumor type generates millions of associations between pairs of features. This defines a large, highly complex graph with associations as edges and features as nodes. Comparison between cancer subtypes can reveal communities that are associated in one cancer but disrupted in another. These cluster/anti-clusters of features may indicate biological systems that have been activated or disrupted. Visual inspection and comparison of such graphs is an inherently difficult challenge. We have developed a technique and tool for visual graph comparison using the Fiedler vector, from spectral graph analysis to compute graph layouts. This enables a user to identify shared and disrupted feature communities. Using this method topological features that differ between graphs are visually distinct and can be selected for further analysis. This process relies on visual inspection and interaction with a meaningful, deterministic graph layout, along with other tools that provide evidence as to the nature of the identified topological features. This tool is built as an HTML5 web application in combination with simple analytical services. The tools utilize efficient sparse matrix math and HTML5 canvas rendering to allow the rapid, interactive analysis of large, structured graphs.
BioVis 2013 Information