Addressing the unmet need for visualizing Conditional Random Fields in Biological Data
Background: The biological world is replete with phenomena that appear to be ideally modeled and analyzed by one archetypal statistical framework - the Graphical Probabilistic Model (GPM). The structure of GPMs is a uniquely good match for biological problems that range from aligning sequences to modeling the genome-to-phenome relationship. The fundamental questions that GPMs address involve making decisions based on a complex web of interacting factors. Unfortunately, while GPMs ideally fit many questions in biology, they are not an easy solution to apply. Building a GPM is not a simple task for an end user. Moreover, applying GPMs is also impeded by the insidious fact that the ``complex web of interacting factors'' inherent to a problem might be easy to define and also intractable to compute upon.
Discussion: We propose that the visualization sciences can contribute to many domains of the bio-sciences, by developing tools to address archetypal representation and user interaction issues in GPMs, and in particular a variety of GPM called a Conditional Random Field(CRF). CRFs bring additional power, and additional complexity, because the CRF dependency network can be conditioned on the query data.
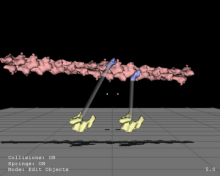
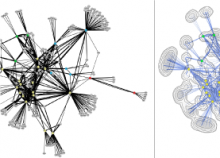
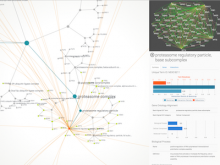
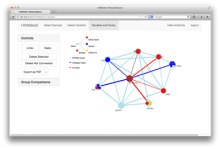
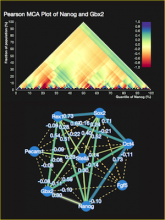
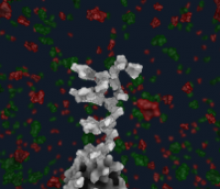
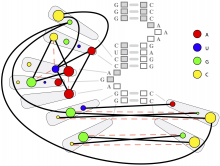
Conclusions: In this manuscript we examine the shared features of several biological problems that are amenable to modeling with CRFs, highlight the challenges that existing visualization and visual analytics paradigms induce for these data, and document an experimental solution called StickWRLD which, while leaving room for improvement, has been successfully applied in several biological research projects.
BioVis 2014 Information
