Analyzing and visualizing protein-protein interactome data
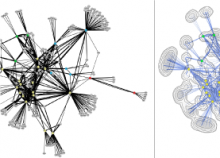
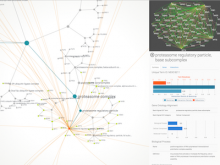
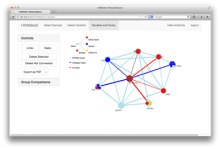
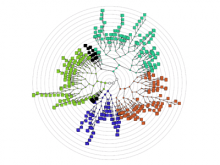
Large and sometimes even small-scale protein-protein interaction studies can present challenges for both correctly analyzing and especially visualizing data. Newer techniques for identifying protein-protein interactions such as BioID magnify these challenges. BioID is a technique for identifying protein interactors through in vivo biotinylation, and not only can direct, stable interactors be identified for a bait protein of interest, but transient/weak interactors as well, and even proteins that simply colocalize with the bait. Since there are generally more 'interactors' identified for BioID relative to classical AP-MS techniques, even a network generated from a small number of baits can be quite dense and hard to interpret, necessitating appropriate methods for visualization. With this type of approach it would also be ideal to differentiate between direct interactors, indirect, strong, weak and neighbouring/colocalizing preys (i.e. neither direct nor indirect but simply vicinal). We have developed and applied approaches for efficiently distinguishing contaminants from true interactors when using BioID, clustering the resulting data, and visualizing large- and small-scale experiments. We have also made progress at distinguishing the various types of 'interactors' that BioID can generate by using variations of the technique (for example, multiple lysis strategies) and by comparing results with complimentary but different methods for identifying interacting proteins. Through BioID and the techniques we are using to analyze the resulting data, we are in the process of elaborating and understanding the networks of a number of disease-related proteins as well as embarking on a larger project for mapping the entire interactome of the cell.
BioVis 2014 Information
