Bacterial Gene Neighborhood Investigation Environment: A Large-Scale Genome Visualization for Big Displays
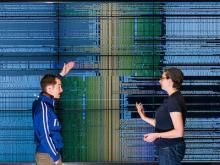
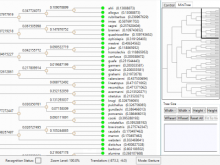
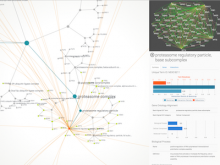
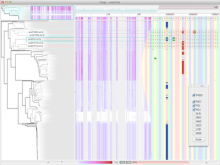
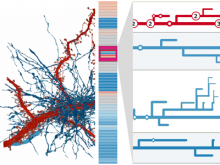
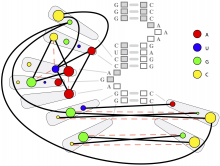
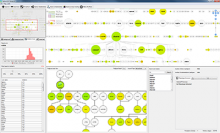
In the past decade, genome sequencing costs have decreased faster than Moore's Law, resulting in a rapid increase in the volume of genomic data. This increased rate of sequencing is particularly evident in bacterial genomics, where thousands of complete bacterial genomes are available for comparative analysis. This data has the potential to address a variety of important questions, so there is a crucial need for visualizations that scale to accommodate comparisons between hundreds of genomes at once. In parallel, advances in display hardware over the past decade have enabled rapid growth and affordability in display resolution and the development of large, high-resolution display environments. While recent research suggests that these environments present benefits to visualization designers, more research is needed to understand the design requirements for particular domain problems in order to best take advantage of these benefits. In this poster, we present Bacterial Gene Neighborhood Investigation Environment, or BactoGeNIE, a new comparative gene neighborhood visualization designed to address large volumes of bacterial genome sequences by taking advantage of the special qualities of large, high-resolution displays. This approach is capable of accommodating significantly more gene neighborhood comparisons than previous tools. In addition, our design considers perceptual issues in viewing large volumes of information on large displays as well as opportunities afforded by environments at human scale. To the authors' knowledge, this is the first interactive, large-scale, comparative gene neighborhood visualization for big displays.
BioVis 2014 Information
