ConTour: Data-Driven Exploration of Multi-Relational Datasets for Drug Discovery
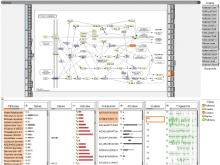
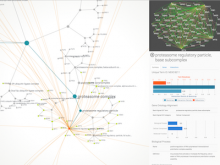
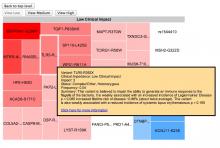
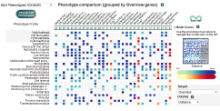
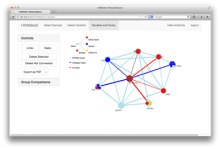
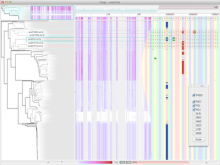
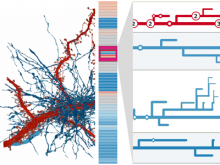
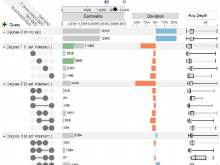
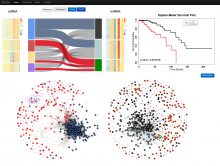
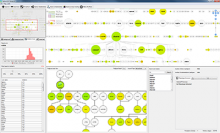
Large scale data analysis is nowadays a crucial part of drug discovery. Biologists and chemists are confronted with many interrelated datasets, but there is a lack of tools that enable them to quickly explore and evaluate potentially effective yet safe compounds based on these many datasets. To remedy this, we developed ConTour, an interactive visual analytics technique that enables the exploration of these complex, multi-relational datasets. At its core ConTour lists all items of each dataset in a column. Relationships between the columns are revealed through interaction: selecting one or multiple elements in one column highlights and re-sorts the others. Filters based on relationships enable a faceted search in the large data space. To identify interesting items in the first place, ConTour employs advanced sorting strategies, including strategies based on connectivity strength and uniqueness, as well as sorting based on item attributes. By allowing users to interactively nest columns, ConTour employs a powerful method to show the related items of a child column for each item in the parent column. Within the columns, ConTour shows rich attribute data about the items as well as information about the connection strengths to other datasets. Finally, ConTour provides several detail views, which can either show one or multiple items from one or multiple datasets and their associated data. We demonstrate our system in case studies conducted with a team of chemical biologists, who investigate the effects of chemical compounds on cells and aim to understand the underlying mechanisms.
BioVis 2014 Information
