dendsort: Heuristic leaf ordering methods for dendrograms in R
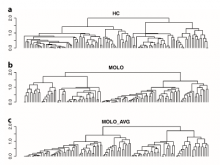
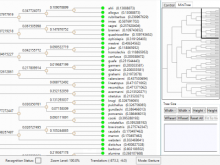
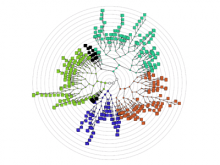
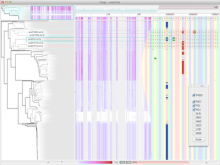
A dendrogram is a graphical representation of a binary tree structure resulting from agglomerative hierarchical clustering. In exploratory data analysis, a cluster heat map is a popular visualization technique that utilizes the leaf order of a dendrogram to reorder the rows and columns of the data table. This derived linear order is more meaningful than a random order, because it groups similar items together. However, the two consecutive items could be quite dissimilar despite the proximity in the linear order. In addition, there are 2^(n-1) possible orderings given n input elements as the orientation of clusters at each merge can be flipped without affecting the hierarchical structure. We present modular leaf ordering methods to encode the monotonic order in which clusters are merged and the nested cluster relationships more clearly and faithfully in the resulting dendrogram structure. We compare dendrogram and cluster heat map visualizations created using our heuristics to the default heuristic in R and seriation-based leaf ordering methods. We find that our methods lead to dendrogram structure with global patterns that are easier to interpret, more legible given a limited display space, and more insightful. The methods are implemented in R and available as an R package, named 'dendsort', from the CRAN package repository. Application of the sorting methods is straightforward and further examples, documentations, and the source code are available at [https://bitbucket.org/biovizleuven/dendsort/].
BioVis 2014 Information
