eXamine: Exploring annotated modules in networks
Background
Biological networks have a growing importance for the interpretation of high-throughput "omics" data. Integrative network analysis makes use of statistical and combinatorial methods to extract smaller subnetwork modules, and performs enrichment analysis to annotate the modules with ontology terms or other available knowledge. This process results in an annotated module, which retains the original network structure and includes enrichment information as a set system. A major bottleneck is a lack of tools that allow exploring both network structure of extracted modules and its annotations.
Results
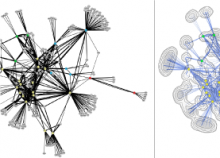
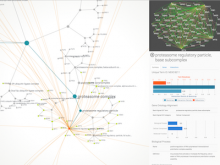
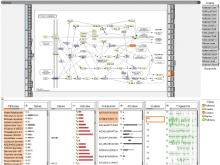
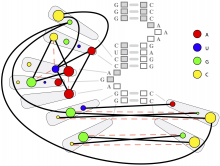
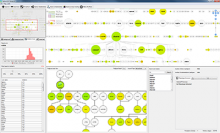
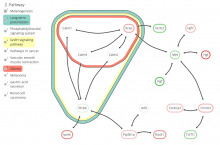
This paper presents a visual analysis approach that targets small modules with many set-based annotations, and which displays the annotations as contours on top of a node-link diagram. We introduce an extension of self-organizing maps to lay out nodes, links, and contours in a unified way. An implementation of this approach is freely available as the Cytoscape app eXamine.
Conclusions
eXamine accurately conveys small and annotated modules consisting of several dozens of proteins and annotations. We demonstrate that eXamine facilitates the interpretation of integrative network analysis results in a guided case study. This study has resulted in a novel biological insight regarding the virally-encoded G-protein coupled receptor US28.
BioVis 2014 Information
