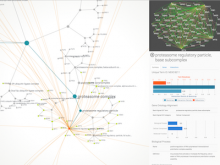
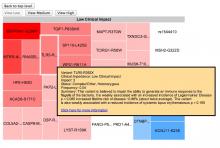
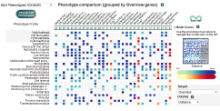
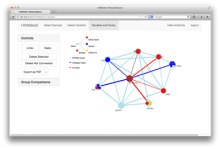
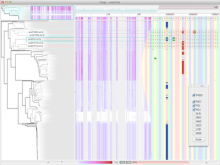
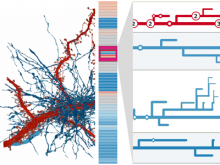
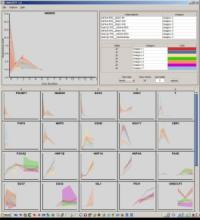
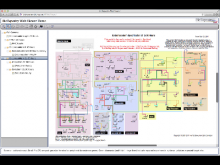
Exploration of metagenome assemblies with an interactive visualization tool.
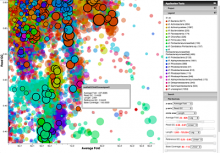
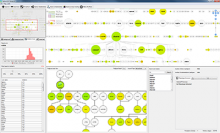
Metagenomics - the genetic profiling of the entire community of microbial organisms present in an environmental sample - is one of the fastest growing areas of modern genomics. Metagenomics datasets are typically only partially assembled, owing to the challenge of aligning millions of sequence reads from many organisms at varying levels of abundance. Sifting through the resulting hundreds of thousands contig consensus sequences to find clusters that identify species is an iterative and labor-intensive process. We have designed a web-based interactive visualization tool, named Elviz, for interpreting and exploring assembled metagenome data. The tool allows scientists to navigate an assembly across multiple dimensions and scales, plotting parameters such as G+C content, relative abundance, phylogenetic affiliation and length. It enables interactive exploration using filters (e.g. removing short contigs), axis rescaling (focusing on a specific G+C content range), axis redefinition (plotting by length to focus on the longest contigs), and movement across scale (drilling from a multi-species plot into the gene organization of a single contig). A search for specific functional genes quickly discovers not only their frequency of occurrence, but also whether they are confined to a few or many genomes. The tool is web-based, built on a new generation of technologies (HTML5, WebGL, d3) that employ the "client" computer's graphical capabilities (GPU) and processing power to render a performant and interactive visualization of tens of thousands of data points. Elviz is publicly available at http://genome.jgi-psf.org/viz.
BioVis 2014 Information
