GeneCalc: An Interactive Visual Analysis framework for Sequencing Datasets
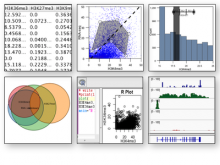
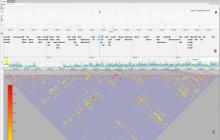
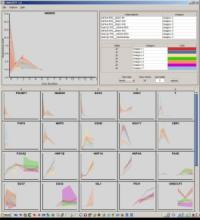
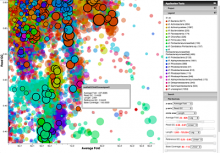
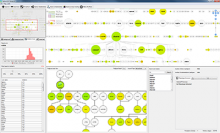
GeneCalc is a visual analysis framework for interactive genome-wide exploration and analysis of sequencing datasets. It is developed as a result of a design study with several biologists to provide an integrated environment for analysis of sequencing data such as ChIP-seq and RNA-seq, while supporting the existing functionality of IGV, a commonly used genome browser. GeneCalc's interface was designed to allow importing the data tracks in the genome browser into a tabular format in which the table rows are genomic intervals (such as genes) and table columns are the sequencing data (e.g. BAM and BigWig format) quantified within those genomic intervals. Users can specify how each dataset is quantified (e.g. around promoters, within exons, etc.) and normalized. Calculated columns can also be created from other columns using a calculator interface (e.g. to subtract an experiment data from the control input data). GeneCalc allows the flexible and seamless adaptation of workflows to various data sets either by (a) adding, replacing, and deleting data from the table (e.g. to compare different data sets), or by (b) change the window size around the transcription start sites. Interactive data viewers including spreadsheet, histogram plot, scatter plot and Venn diagram are dynamically linked through brushing operations. GeneCalc is integrated with the IGV and users can interact with the plots to navigate the genomics viewer to the corresponding genomic locations. GeneCalc also provides an interface with the R environment to facilitate employing existing libraries and extending the analysis and visualization capabilities of the framework.
Find out more at http://genecalc.com
BioVis 2014 Information
