Gingr: Interactive visualization of large-scale phylogenies and multi-alignments.
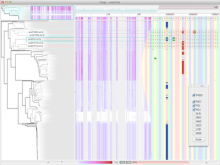
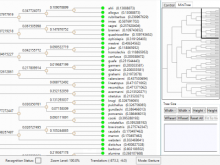
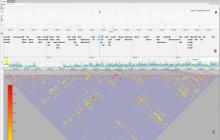
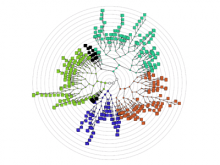
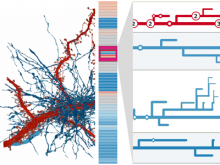
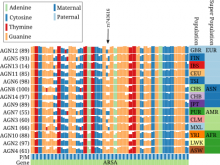
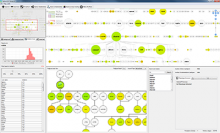
The reconstruction of microbial phylogenies is complicated by myriad factors, including horizontal gene transfer, mobile elements, prophages and mis-alignments. Assessing the impact of these factors is made easier by visualizing both phylogenetic trees and the multi-alignments they are inferred from. This task, however, becomes increasingly difficult as the number of available genomes, even for specific species or strains, grows beyond the effective capacity of current tools for displaying alignments and phylogenies. To facilitate both exploratory research and quality control for the future of bacterial genomics, we present Gingr, an interactive tool for exploring large-scale phylogenies in tandem with their corresponding multi-alignments. Gingr can display informative overviews for hundreds or thousands of genomes, while allowing researchers to move quickly to more detailed views of specific subclades and genomic regions, even down to the nucleotide level of their multi-alignments. Additionally, its dynamic display of variants allows interactive selection of various filters, such as indels, poorly aligned regions and suspected sites of recombination. Gingr works chiefly in tandem with Parsnp, an efficient tool for core-genome multi-alignment and phylogenetic reconstruction. It is also applicable, however, to other analytical tools, accepting standard file formats such as multi-Fasta, XMFA, Newick and VCF. Gingr is open-source and is available for Linux and Mac OS X from github.com/marbl.
BioVis 2014 Information
