GWAS Viewer - a fast and interactive visualization for GWAS results
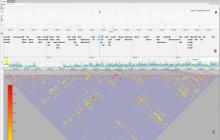
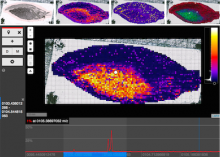
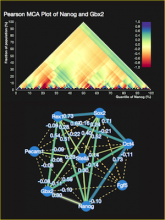
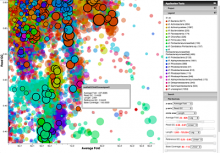
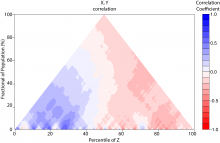
The rapid development in sequencing technologies have made Genome Wide Association Studies (GWAS) a powerful tool for investigating the genetic architecture of traits. Traditionally, GWAS results are visualized using Manhattan charts, and these are typically embedded in Genome Browsers, which allows researchers to investigate the relationship of a GWAS peak with its surrounding genes. Because of the high number of markers in a typical GWAS, visualization has been a challenge and, in many cases, is neither interactive nor fast. Here, we present a fast and interactive web-based visualization that consists of 3 interactive and connected parts: (1) a Manhattan chart, (2) a gene annotation track and (3) a triangle plot that reports the linkage disequilibrium (LD) in the area. The Manhattan chart can be used to visualize P-values of up to 10,000 markers at a time, and users can quickly zoom into specific regions (i.e a GWAS peak). Below a certain threshold, a gene annotation is displayed underneath the plot. The visualization uses HTML5 Canvas for displaying thousands of data points efficiently and thus only requires a modern browser. Each of the 3 display items have been packaged as an independent library and can be used stand-alone if the user chooses. Although the visualization was developed specifically for visualizing GWAS results, it can also be used in other areas, making it a valuable contribution to the BioVis community.
BioVis 2014 Information
