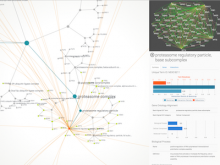
Helium: Visualization of Large Scale Plant Pedigrees
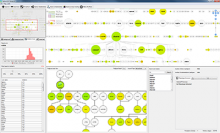
Plant breeders use an increasingly diverse range of data types to identify lines with desirable characteristics suitable to be taken forward in plant breeding programmes. There are a number of key morphological and physiological traits, such as disease resistance and yield, that need to be maintained and improved upon if a commercial variety is to be successful. Computational tools that provide the ability to integrate and visualize this data with pedigree structure, will enable breeders to make better decisions on the lines that are used in crossings to meet both the demands for increased yield/production and adaptation to climate change.
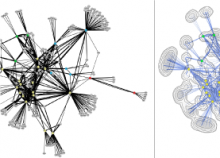
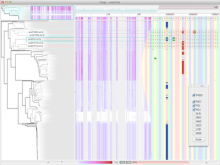
We have used a large and unique set of experimental barley (H. vulgare) data to develop a prototype pedigree visualization system. We then used this prototype to perform a subjective user evaluation with domain experts to guide and direct the development of an interactive pedigree visualization tool called Helium.
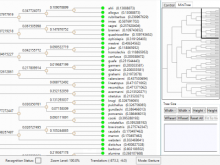
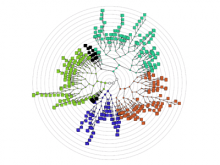
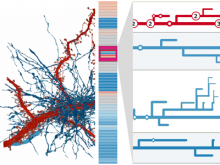
We show that Helium allows users to easily integrate a number of data types along with large plant pedigrees to offer an integrated environment in which they can explore pedigree data. We have also verified that users were happy with the abstract representation of pedigrees that we have used in our visualization tool.
BioVis 2014 Information
