iGPSe: A Visual Analytic System for Integrative Genomic Based Cancer Patient Stratification

Background: Cancers are highly heterogeneous with different subtypes. These subtypes often possess different genetic variants, present different pathological phenotypes, and most importantly, show various clinical outcomes such as varied prognosis and response to treatment and likelihood for recurrence and metastasis. Recently, integrative genomics (or panomics) approaches are often adopted with the goal of combining multiple types of omics data to identify integrative biomarkers for stratification of patients into groups with different clinical outcomes.
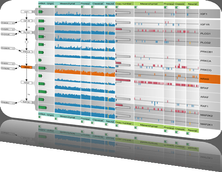
Results: In this paper we present a visual analytic system called Interactive Genomics Patient Stratification explorer (iGPSe) which significantly
reduces the computing burden for biomedical researchers in the process of exploring complicated integrative genomics data. Our system integrates unsupervised clustering with graph and parallel sets visualization and allows direct comparison of clinical outcomes via survival analysis. Using a breast cancer dataset obtained from the The Cancer Genome Atlas (TCGA) project, we are able to quickly explore different combinations of gene expression (mRNA) and microRNA features and identify potential combined markers for survival
prediction.
Conclusions: Visualization plays an important role in the process of stratifying given population patients. Visual tools allowed for the selection of possibly features across various datasets for the given patient population. We essentially made a case for visualization for a very important problem in translational informatics.
BioVis 2014 Information


