inPHAP: Interactive visualization of genotype and phased haplotype data
Background: To understand individual genomes it is necessary to look at the variations that lead to changes in phenotype and possibly to disease. However, genotype information alone is often not sufficient and additional knowledge regarding the phase of the variation is needed to make correct interpretations. Interactive visualizations, that allow the user to explore the data in various ways, can be of great assistance in the process of making well informed decisions. But, currently there is a lack for visualizations that are able to deal with phased genotype data.
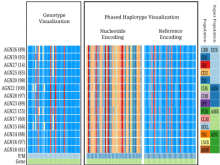
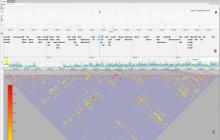
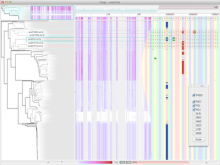
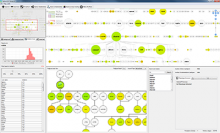
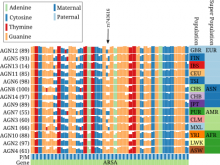
Results: We present inPHAP, an interactive visualization tool for genotype and phased haplotype data. inPHAP features a variety of interaction possibilities such as zooming, sorting, filtering and aggregation of rows in order to explore patterns hidden in large genetic data sets. As a proof of concept, we apply inPHAP to the phased haplotype data set of Phase 1 of the 1000 Genomes Project. Thereby, inPHAP's ability to show genetic variations on the population as well as on the individuals level is demonstrated for several disease related loci.
Conclusions: As of today, inPHAP is the only visual analytical tool that allows the user to explore unphased and phased haplotype data interactively. Due to its highly scalable design, inPHAP can be applied to large datasets with up to 100 GB of data, enabling users to visualize even large scale input data. inPHAP closes the gap between common visualization tools for unphased genotype data and introduces several new features, such as the visualization of phased data. inPHAP is available for download at http://bit.ly/1iJgKmX.
BioVis 2014 Information
