Interactive Exploration of Spatial Distribution in Mass Spectrometry Imaging
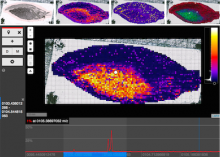
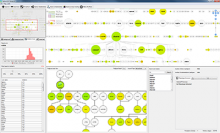
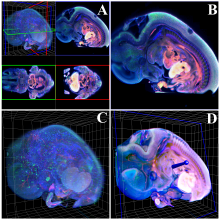
Mass spectrometry imaging generates a series of localized mass spectra from discrete positions on a tissue or thin-film, thereby providing comprehensive information on molecular composition and spatial distribution in a single experiment. This allows for an untargeted and simultaneous measurement of a wide variety of molecules. The resulting data is commonly interpreted as a stack of images where each image shows the intensity distribution of one m/z value across all measured positions. Manual inspection for spatial patterns in those image stacks is not feasible, therefore consecutive analysis frequently targets only a few preselected molecules or relies on automated but undirected segmentation. QUIMBI (QUIck exploration tool for Multivariate BioImages) is a web-browser-based visualization tool that augments manual inspection with interactive aggregation and filtering capabilities. The similarity between a selected seed spectrum and the spectra of all positions is computed and encoded with a color scale to generate a pseudo color map of the sample. The researcher can change the seed position interactively by hovering positions in the image to see which regions are similar compared to the current spectrum and limit the comparison to selected m/z ranges and regions of interest. For multiple seed spectra the pseudo color maps are combined to a fusion image. The researcher can also select regions of interest in the image to display their mean spectra or select ranges in the spectrum viewer to get the corresponding mean intensity image. We are currently working to integrate identified patterns into sets of overlapping segmentations for further analysis.
BioVis 2014 Information
