LONGEVITY: A novel visualization platform for interpreting multidimensional gene expression
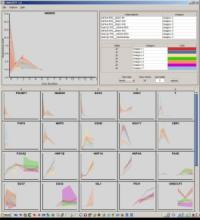
Understanding patterns in the longitudinal expression for multiple genes is a challenging problem frequently encountered in various biological fields such as stem cell and systems biology research. In drug research, stem cells can be used to develop batches of somatic cells for testing. However, the cell differentiation process from stem cells to tissue-specific somatic cells often requires very precise controls. To ensure minimal inter-batch variation, the expression levels of various genes critical to the differentiation process are measured throughout the process to ensure reproducibility. LONGEVITY (Longitudinal Gene Expression Visual Tracker) provides a visual interpretation of mean and variance of the expression levels as a function of time that complements statistical approaches. The colored bands show the 95% confidence intervals of the batch expression measured as a function of time. The correlation between batches can be seen within one gene in the larger view, or across many genes using the thumbnail view. To compare many batches with a finite set of discernible transparent colors, users can group batches into categories, and interactively specify both the colors and visibility for each. LONGEVITY has been successfully applied to stem cell research domain and to systems biology pathway reconstruction where the expression of many genes at multiple time points were measured for across multiple plates of cells following initial stimuli.
BioVis 2014 Information
