The Monarch Initiative Phenotype Grid
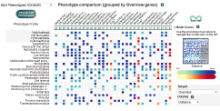
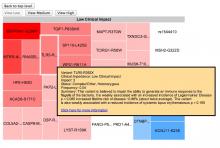
Comparisons between clinical presentations of human patients and phenotypic profiles of animal strains can be useful for the identification of models suitable for the study of rare diseases. Our prior work has valid the use of computational tools based on phenotype ontology structures and associated annotations to statistically infer similarities between human phenotype annotation sets against mouse models. One of the goals of the Monarch Initiative (www.monarchinitiative.org) is to provide interactive visualizations that support exploration of the results of these analyses. Based on consideration of uses cases from Hereditary Inclusion Body Myopathy (HIBM) and Parkinson's disease, we have identified a series of design requirements, including support for the comparison of individual phenotypes between profiles, examination of the coverage of a human phenotype across animal targets, comparison of models, access to details about models and phenotypes. A visualization constructed with the D3 and jQuery Javascript libraries provides a grid-based display, with phenotypes in rows and models in columns. This grid provides supports the simultaneous comparison of numerous models at once (column comparisons) and the examination of the prevalence of a given phenotype in multiple models (row comparisons). The phenotype grid is available as a jQuery widget, suitable for integration in third-party web sites. Future work will augment the tool with facilities for navigating hierarchical ontology structures, through interactions that will provide greater clarity by basing comparisons on more or less specific phenotype. Additional plans also include comparative design evaluations and iterative development based on user feedback
BioVis 2014 Information
