NeXO Web: An integrated ontology visualization application for modern web platforms
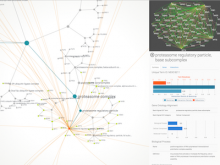
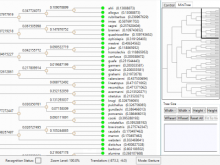
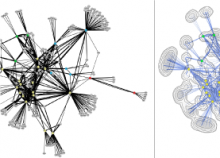
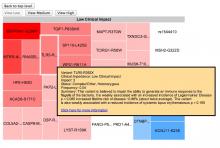
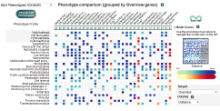
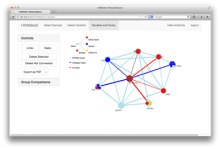
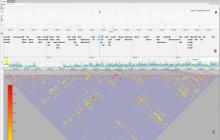
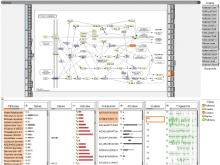
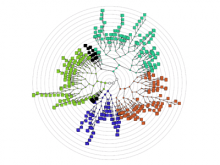
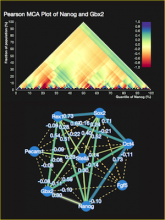
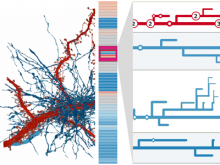
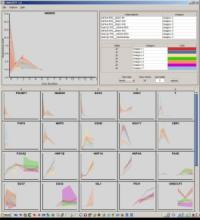
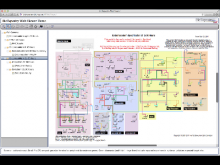
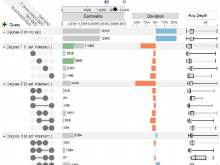
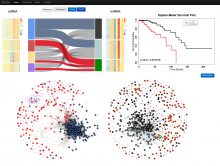
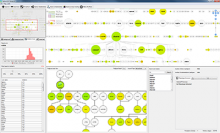
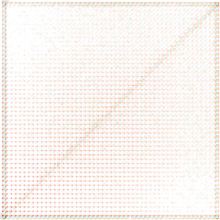
The NeXO Web (http://www.nexontology.org/) is an integrated data visualization application for the Network-extracted Ontology (NeXO), a gene ontology inferred directly from large-scale molecular networks. It presents a global hierarchy of cellular components and processes as a directed acyclic graph (DAG) composed of NeXO terms derived from thousands of individual gene and protein interactions found in public databases. Though these data are complex and heterogeneous, NeXO Web integrates them into interactive and intuitive views, which include ontology DAGs, raw interactions, statistics for the NeXO terms, and annotations for genes. NeXO Web includes the NeXO ontology and three Gene Ontologies visualized as trees, enabling users to visualize, browse, and perform term enrichment analysis from a single unified user interface. Additionally, the application can be applied to existing ontology DAGs to produce new, unique, and informative visualizations. In this poster, we present visualization techniques for these heterogeneous large data sets, an in-depth view of technologies we used, and difficulties we encountered in implementing this complex application utilizing modern web technologies such as HTML5, graph database, and JavaScript. As NeXO Web is a prototype that demonstrates a migration path for traditional biologic desktop visualization tools into the modern web world, we discuss potential future applications based on this evolving framework.
BioVis 2014 Information
