PhyloPen: Visualizing and Annotating Phylogenetic Trees with a Pen and Touch Interface
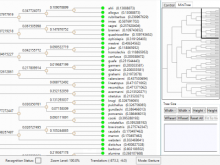
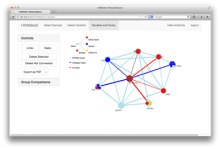
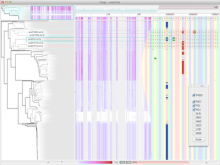
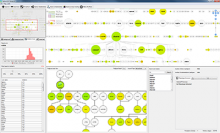
Evolutionary biologists use phylogenetic trees as a visualization tool for interpreting and analyzing characteristics across a group of species over time with all leading back to a common ancestor. Until recently, phylogenetic trees have largely been presented as static figures included in academic papers. Our goal is to provide a more interactive experience for biology experts in exploring and handling phylogenetic trees. In this work-in-progress, we start by evaluating pen and touch interface technologies for the application of phylogenetic tree browsing through the creation and evaluation of a pen- and touch-based tree viewer called PhyloPen. Over a number of iterations, a final preliminary user interface has been implemented, including gestures for zooming, translating, annotating, swapping children, expanding and collapsing parts of the tree, and resizing the tree. We also include a World-in-Miniature version of the phylogenetic tree for help in navigating the tree. Our preliminary user interface has been evaluated through an informal user study conducted by a group of biologists. Our results suggest that our gesture-based interface requires further testing and development before it can replace traditional mouse and keyboard interfaces. However, users interviewed believe the pen and touch functionality holds promise for improving user experiences, generally finding the pen and touch features more natural and intuitive for browsing phylogenetic trees than existing non-interactive tools.
BioVis 2014 Information
