Refinery Platform: A Foundation for Integrative Data Visualization Tools
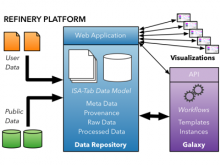
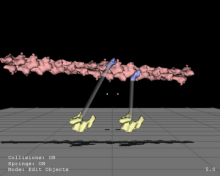
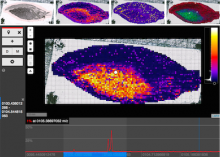
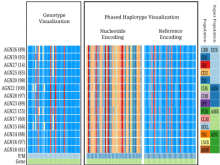
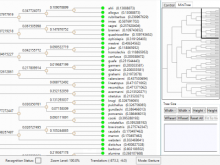
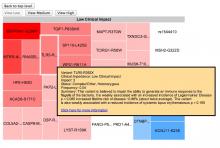
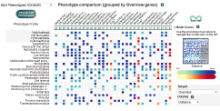
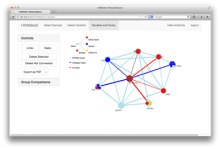
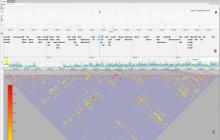
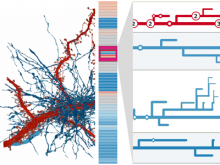
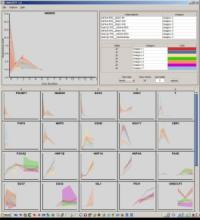
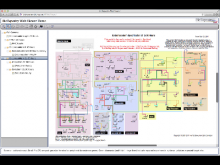
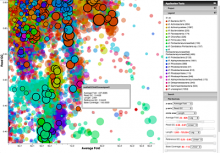
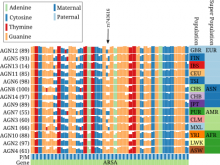
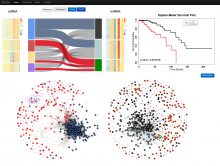
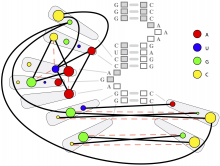
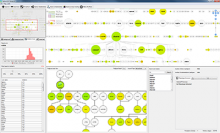
Datasets with dozens or hundreds of samples are now common in biology. Manually keeping track of software and data used in analyses is tedious and error prone. Furthermore, using visual exploration tools to study the results of such analyses is currently not well supported. To address these challenges, we are developing the web-based Refinery Platform (www.refinery-platform.org). This flexible analysis platform is designed to accommodate diverse data and workflows; our current implementation focuses on epigenomics and cancer genomics. One goal for this system is to serve as a platform for the development of novel visual exploration tools, that can directly access large and complex datasets and analysis results, and trigger new analyses on these data. The Refinery Platform enables reproducible analyses by combining two powerful, community-supported tools: (1) a data repository with rich metadata capabilities based on ISA-Tab (www.isacommons.org) and (2) a workflow engine based on the popular Galaxy framework (www.galaxyproject.org). The ISA-Tab-based data model provides extensive provenance information in an "experiment graph", which links all files to the inputs that they were derived from. Workflows are executed by in Galaxy. The Galaxy workflow editor is used to create a "workflow template" that is imported by the Refinery Platform, automatically instantiated based on the inputs selected by the user, and exported back into Galaxy through its API. Workflow results are downloaded into Refinery from Galaxy, added to the experiment graph, and made available for visualization and as input for further analyses.
BioVis 2014 Information
