UpSet for Visualizing Intersecting Sets in Biology
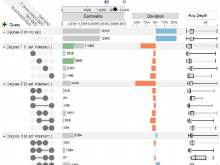
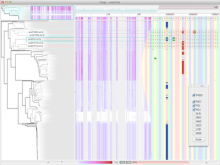
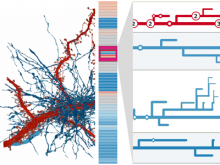
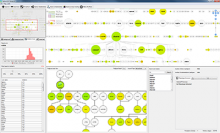
Understanding relationships between sets is an important analysis task in molecular biology. The major challenge in this context is the combinatorial explosion of the number of intersections if the number of sets exceeds a trivial threshold. To address this we introduce UpSet, a novel visualization technique for the quantitative analysis of sets, their intersections, and aggregates of intersections. UpSet focuses on creating task-driven aggregates, communicating the size and properties of aggregates and intersections. It shows the duality between the visualization of the elements in a dataset and their set membership. UpSet visualizes set intersections in a matrix layout and allows aggregation based on common properties as well as boolean queries. The size of an intersection is displayed using bars aligned to the rows of the matrix. The matrix layout also enables the effective representation of associated data, such as measures derived from set or element attributes. Sorting according to various measures enables a task-driven analysis of relevant intersections and aggregates. The elements represented in the sets and their associated attributes are visualized in a separate view. Queries based on containment in specific intersections, aggregates or driven by attribute filters are propagated between both views. We use UpSet to visualize various biological problems, such as to evaluate tools that identify single nucleotide variants (SNV) in human genomes, to understand the interactions of compounds with proteins and to discover common co-mutations in cancer. UpSet is open source and available at http://vcg.github.io/upset.
BioVis 2014 Information
