Visualization and Correction of Automated Segmentation, Tracking and Lineaging from 5-D Stem Cell Image Sequences

Neural stem cells are motile and proliferative cells that undergo mitosis, dividing to produce daughter cells and ultimately producing differentiated neurons and glia. Understanding the mechanisms controlling neural stem cell migration and proliferation will play a key role in the emerging field of regenerative medicine and in cancer therapeutics. Neural stem cell studies \textit{in vitro} are maturing; however, the cell's environment may play a pivotal role in determining cell fate. Thus cells must be observed in their native niche. Visualizing a three dimensional image of an intact tissue sample for quantitative and qualitative analysis is non-trivial. It becomes more difficult when the tissue sample is large and imaged at sub-cellular resolution or when imaged over time.
Results
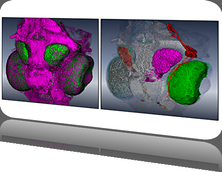
We present an application that enables the quantitative analysis of multichannel 5-D $(x,y,z,t,channel)$ and large montage confocal fluorescence microscopy images. The image sequences show stem cells together with blood vessels, enabling quantification of the dynamic behaviors of stem cells in relation to their vascular niche, with applications in developmental and cancer biology. Our application automatically segments, tracks, and lineages the image sequence data and then allows the user to view and edit the results of automated algorithms in a stereoscopic 3-D window while simultaneously viewing the stem cell lineage tree in a 2-D window. Using the GPU to store and render the image sequence data enables a hybrid computational approach. An inference-based approach utilizing user-provided edits to automatically correct related mistakes executes interactively on the system CPU while the GPU handles 3-D visualization tasks.
Conclusions
By exploiting commodity computer gaming hardware, we have developed an application that can be run in the laboratory to facilitate rapid iteration through biological experiments. There is a pressing need for visualization and analysis tools for 5-D live cell image data. We combine accurate unsupervised processes with an intuitive visualization of the results. Our validation interface allows for each data set to be corrected to 100\% accuracy, ensuring that downstream data analysis is accurate and verifiable. Our tool is the first to combine all of these aspects, leveraging the synergies obtained by utilizing validation information from stereo visualization to improve the low level image processing tasks.
BioVis 2014 Information


