Visualization of Large Volumetric Multi-Channel Microscopy Data Streams on Standard PCs
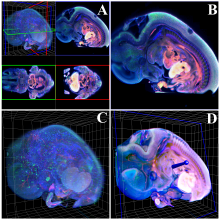
Background: Visualization of multi-channel microscopy data plays a vital role in biological research. With the ever-increasing resolution of modern microscopes the data set size of the scanned specimen grows steadily. On commodity hardware this size easily exceeds the available main memory and the even more limited GPU memory. Common volume rendering techniques require the entire data set to be present in the GPU memory. Existing out-of-core rendering approaches for large volume data sets either are limited to single-channel volumes, or require a computer cluster, or have long preprocessing times.
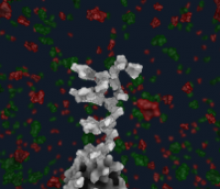
Results: We introduce a ray-casting technique for rendering large volumetric multi-channel microscopy data streams on commodity hardware. The volumetric data is managed at different levels of detail by an octree structure. In contrast to previous octree-based techniques, the octree is built incrementally and therefore supports streamed microscopy data as well as data set sizes exceeding the available main memory. Furthermore, our approach allows the user to interact with the partially rendered data set at all stages of the octree construction. After a detailed description of our method, we present performance results for different multi-channel data sets with a size of up to 24 GB on a standard desktop PC.
Conclusions: Our rendering technique allows biologists to visualize their scanned specimen on their standard desktop computers without high-end hardware requirements. Furthermore, the user can interact with the data set during the initial loading to explore the already loaded parts, change rendering parameters like color maps or adjust clipping planes. Thus, the time of biologists being idle is reduced. Also, streamed data can be visualized to detect and stop flawed scans early during the scan process.
BioVis 2014 Information
