Accepted Papers for BioVis@ISMB 2017
BioVis@ISMB 2017 has now concluded
Check back next year for more opportunities to participate in BioVis@ISMB. We also have a workshop being held in conjunction with IEEE VIS, BioVis@VIS, that will take place in October 2017.
All accepted papers are accessible via BMC Bioinformatics
|
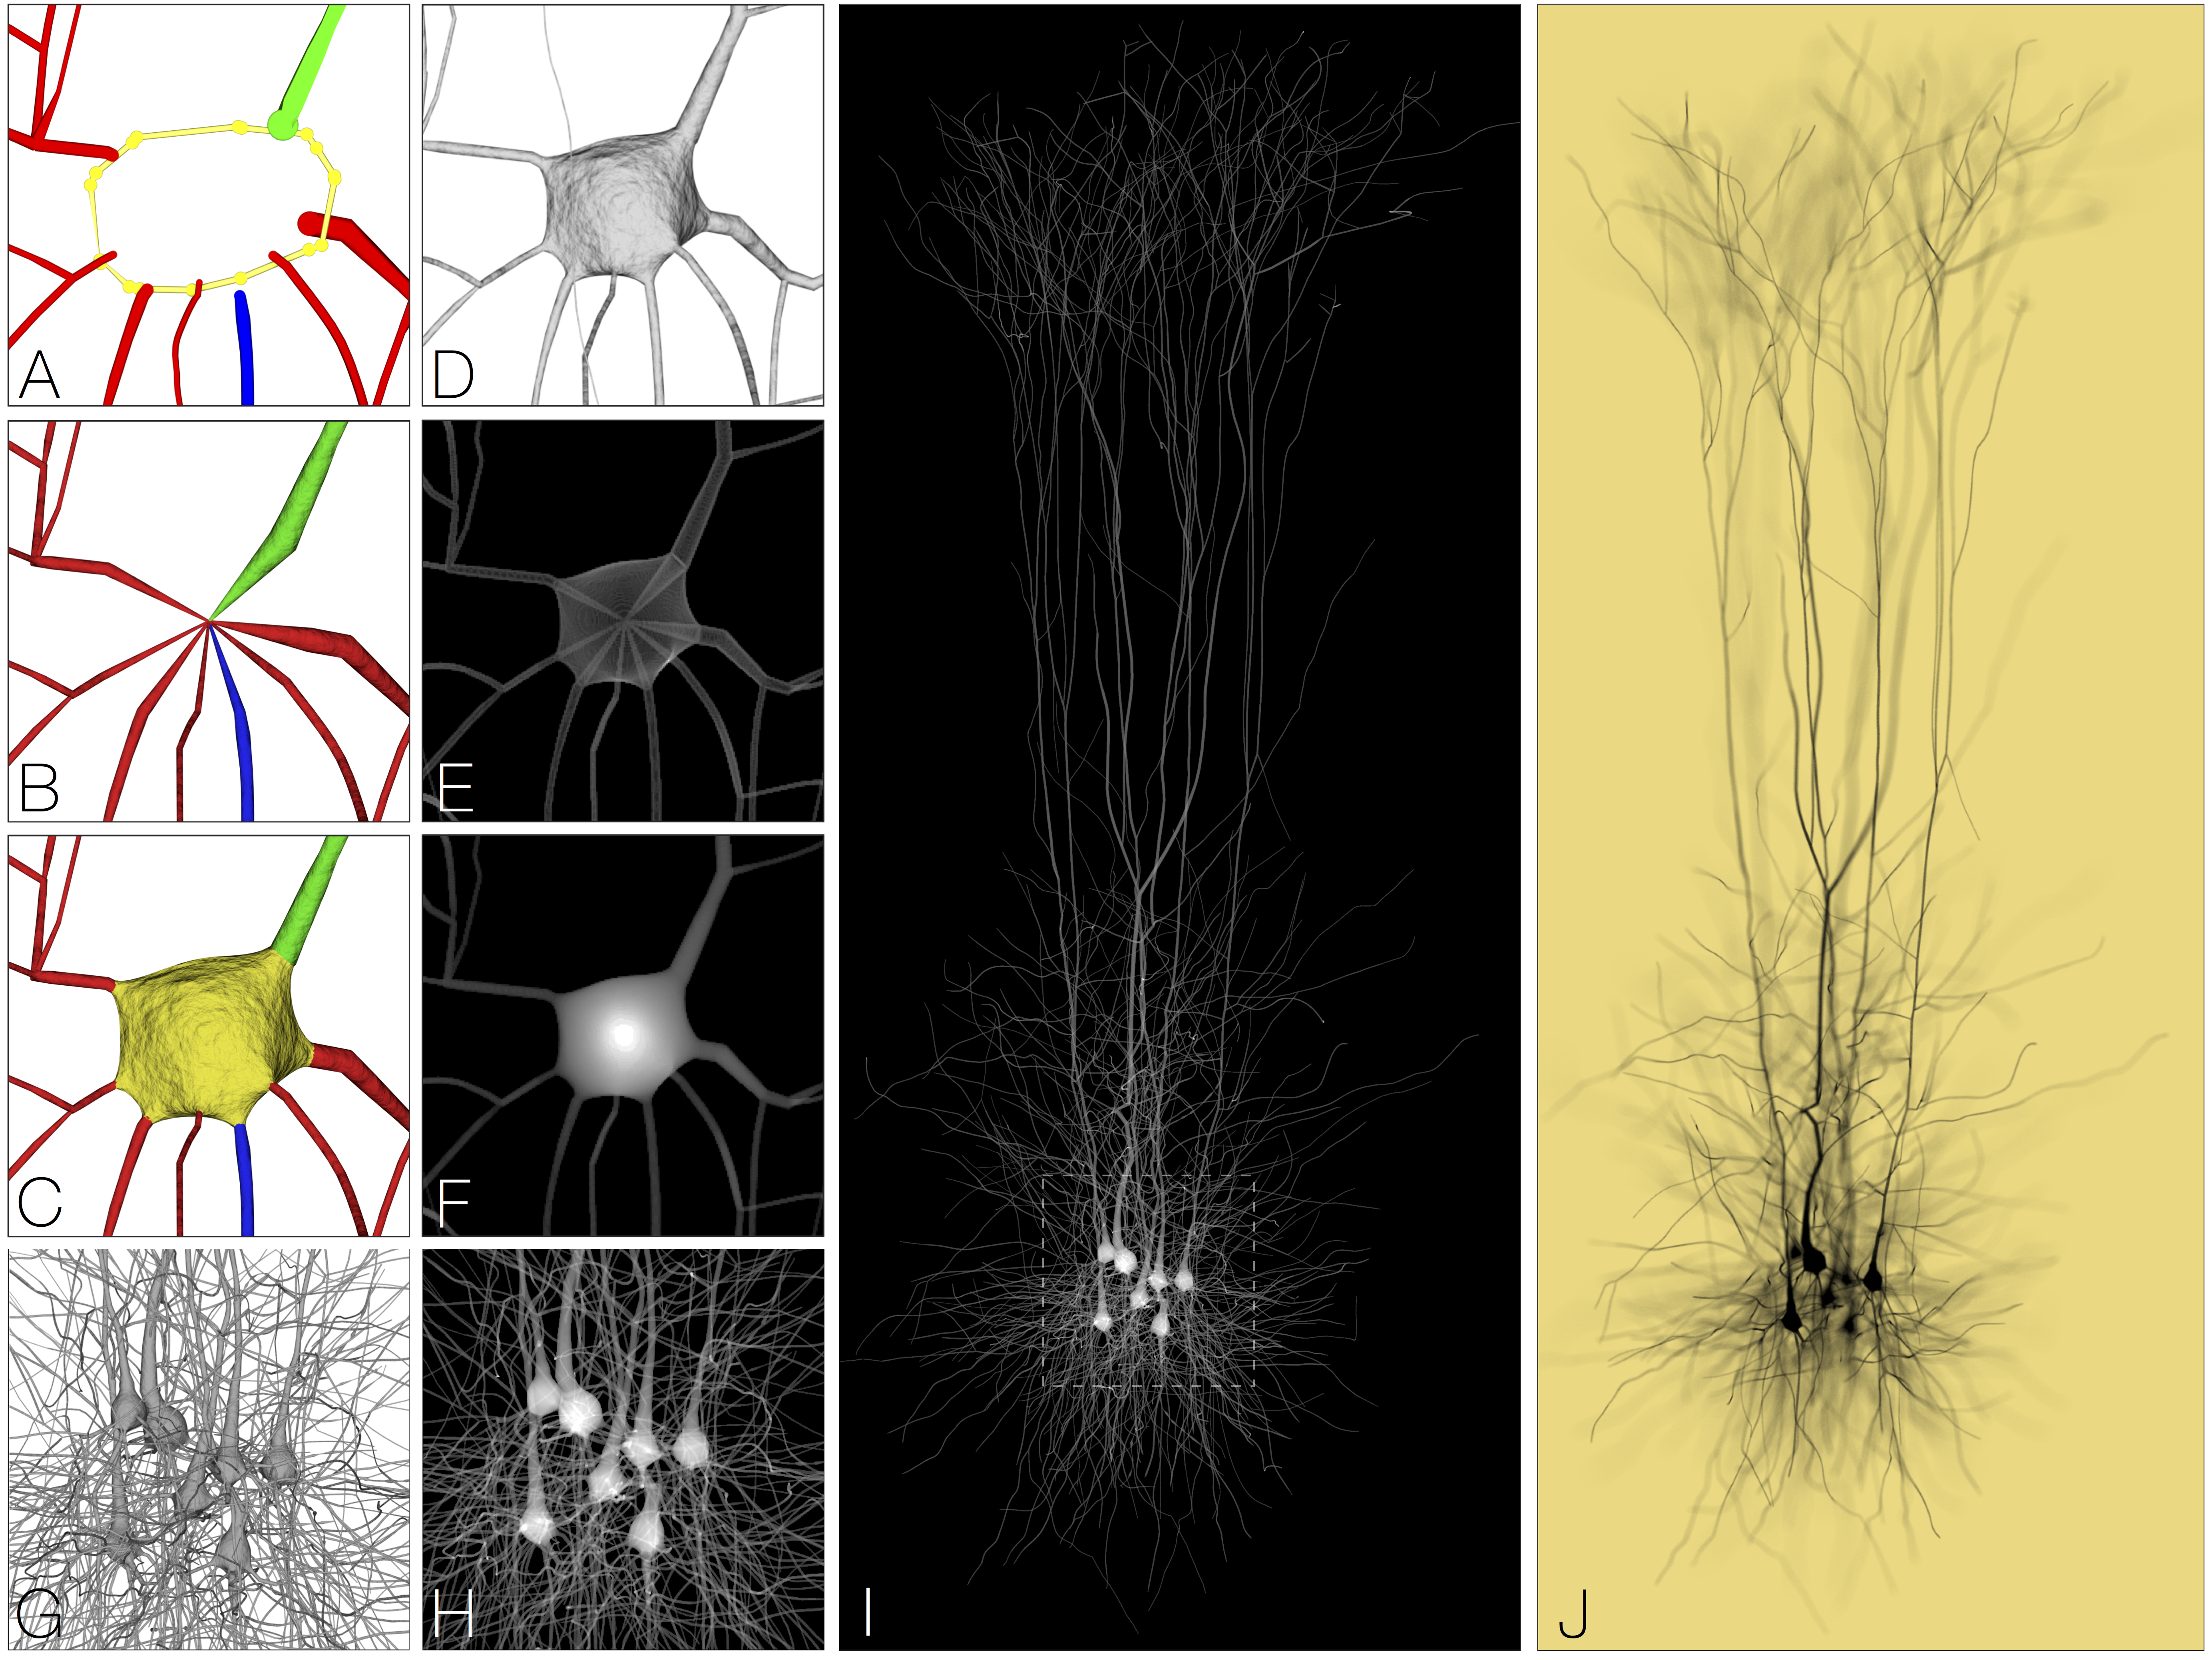
Reconstruction and visualization of large-scale volumetric models of neocortical circuits for physically-plausible in silico optical studies
Marwan Abdellah*, Juan Hernando, Nicolas Antille, Stefan Eilemann, Henry Markram, Felix Schurmann Presentation Info: "Networks and Spatial Data" session between 11:00 to 11:20 Background: We present a software workflow capable of building large scale, highly detailed and realistic volumetric models of neocortical circuits from the morphological skeletons of their digitally reconstructed neurons. The limitations of the existing approaches for creating those models are explained, and then, a multi-stage pipeline is discussed to overcome those limitations. Starting from the neuronal morphologies, we create smooth piecewise watertight polygonal models that can be efficiently utilized to synthesize continuous and plausible volumetric models of the neurons with solid voxelization. The somata of the neurons are reconstructed on a physically-plausible basis relying on the physics engine in Blender. Results: Our pipeline is applied to create 55 exemplar neurons representing the various morphological types that are reconstructed from the somatsensory cortex of a juvenile rat. The pipeline is then used to reconstruct a volumetric slice of a cortical circuit model that contains _210,000 neurons. The applicability of our pipeline to create highly realistic volumetric models of neocortical circuits is demonstrated with an in silico imaging experiment that simulates tissue visualization with brightfield microscopy. The results were evaluated with a group of domain experts to address their demands and also to extend the workflow based on their feedback. Conclusion: A systematic workflow is presented to create large scale synthetic tissue models of the neocortical circuitry. This workflow is fundamental to enlarge the scale of in silico neuroscientific optical experiments from several tens of cubic micrometers to a few cubic millimeters. |
|
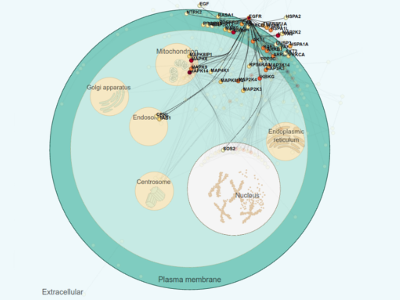
CellNetVis: a web tool for visualization of biological networks using force-directed layout constrained by cellular components
Henry Heberle*, Marcelo Falsarella Carazzolle, Guilherme Pimentel Telles, Gabriela Vaz Meirelles and Rosane Minghim Presentation Info: "Networks and Spatial Data" session between 12:00 to 12:20 The advent of "omics" science has brought new perspectives in contemporary biology through the high-throughput analyses of molecular interactions, providing new clues in protein/gene function and in the organization of biological pathways. Biomolecular interaction networks, or graphs, are simple abstract representations where the components of a cell (e.g. proteins, metabolites etc.) are represented by nodes and their interactions are represented by edges. An appropriate visualization of this data is crucial for understanding such networks, since pathways are related to functions that occur in specific regions of the cell. The force-directed layout is an important and widely used technique to draw networks according to their topologies. Placing the networks into cellular compartments helps to quickly identify where network elements are located and, more specifically, concentrated. Currently, only a few tools provide the capability of visually organizing networks by cellular compartments. Most of them cannot handle large and dense networks. Even for small networks with hundreds of nodes the available tools are not able to reposition the network while the user is interacting, limiting the visual exploration capability. Here we propose CellNetVis, a web tool to easily display biological networks in a cell diagram employing a constrained force-directed layout algorithm. The tool is freely available and open-source. It was originally designed for networks generated by the Integrated Interactome System and can be used with networks from others databases, like InnateDB. CellNetVis has demonstrated to be applicable for dynamic investigation of complex networks over a consistent representation of a cell on the Web, with capabilities not matched elsewhere. |
|
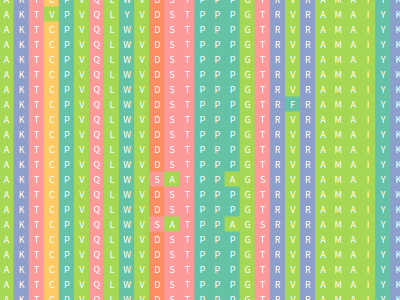
Vermont: multi perspective visual interactive platform for mutational analysis
Alexandre Fassio*, Pedro Martins, Samuel Guimaraes, Socrates Araujo Junior, Vagner Ribeiro, Raquel de Melo-Minardi and Sabrina Silveira Presentation Info: "Mutations and Next Generation Sequencing" session between 14:45 to 15:05 A huge amount of data involving genomes and sequence variation is already available and continue to grow on large scale, which makes infeasible experimentally characterizing these variations in terms of disease association and effects on protein structure and function. Therefore, reliable computational approaches are needed to support on the understanding of mutations and their impacts. Here, we present VERMONT 2.0, a visual interactive platform that combines sequence and structural parameters with powerful interactive visualizations to make the impact of protein point mutation more understandable. We aim to contribute a novel visual analytics oriented method to analyze and gain insight on protein point mutation impact. To access VERMONT ability in doing so, we visually examined a set of mutations experimentally characterized to check if VERMONT could help pointing out damaging mutations and why they can be considered damaging. VERMONT allowed us to understand mutations by interpreting position-specific structural and physicochemical properties. Also, we point out some specific positions we believe would impact on protein function/structure in case of mutation. |
|
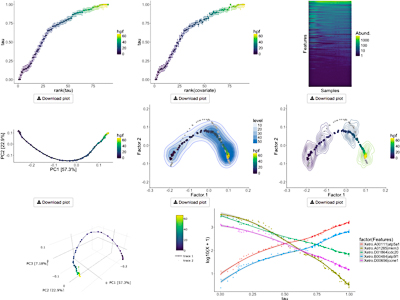
Bayesian Unidimensional Scaling for visualizing uncertainty in high dimensional datasets with latent ordering of observations
Lan Huong Nguyen* and Susan Holmes Presentation Info: "Machine Learning and Medicine" session between 16:30 to 16:50 Background: Detecting patterns in high-dimensional multivariate datasets is non-trivial. Clustering and dimensionality reduction techniques often help in discerning inherent structures. In biological datasets such as microbial community composition or gene expression data, observations can be generated from a continuous process, often unknown. Estimating data points' `natural ordering' and their corresponding uncertainties can help researchers draw insights about the mechanisms involved. Results: We introduce a Bayesian Unidimensional Scaling (BUDS) technique which extracts dominant sources of variation in high dimensional datasets and produces their visual data summaries, facilitating the exploration of a hidden continuum. The method maps multivariate data points to latent one-dimensional coordinates along their underlying trajectory, and provides estimated uncertainty bounds. By statistically modeling dissimilarities and applying a DiSTATIS method to their posterior samples, we are able to incorporate visualizations of uncertainties in the estimated data trajectory across different regions using confidence contours for individual data points. We also illustrate the estimated overall data density across different areas by including density clouds. One-dimensional coordinates recovered by BUDS help researchers discover sample attributes or covariates that are factors driving the main variability in a dataset. We demonstrated usefulness and accuracy of BUDS on a set of published microbiome 16S and single cell RNA-seq data. Conclusions: Our method effectively recovers and visualizes natural orderings present in datasets. Automatic visualization tools for data exploration and analysis are available at: https://github.com/nlhuong/visTrajectory |
|
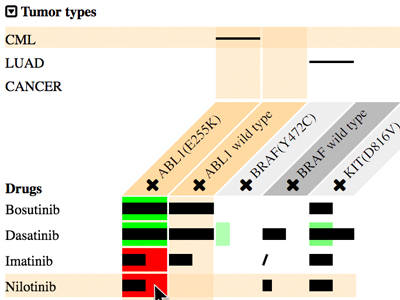
MediSyn: Uncertainty-aware Visualization of Multiple Biomedical Datasets to Support Drug Treatment Selection
Chen He*, Luana Micallef, Zia-Ur-Rehman Tanoli, Samuel Kaski, Tero Aittokallio and Giulio Jacucci Presentation Info: "Machine Learning and Medicine" session between 16:50 to 17:10 Dispersed biomedical databases limit user exploration to generate structured and holistic knowledge. Linked Data unifies data structures and makes the dispersed data easy to search across resources, but it lacks supporting human cognition to achieve insights. In addition, potential errors in the data are difficult to detect in their free formats. Devising a visualization that synthesizes multiple sources in such a way that uncertainties, such as data conflicts, are salient is challenging. To investigate the requirements and challenges of uncertainty-aware visualizations of linked data, we developed MediSyn, a system that synthesizes medical datasets to support drug treatment selection. It uses a matrix-based layout to visually link drugs, targets (e.g., mutations), and tumor types. Data uncertainties are salient in MediSyn; for example, (i) missing data are exposed in the matrix view of drug-target relations; (ii) inconsistencies between datasets are shown via overlaid layers; and (iii) data credibility is conveyed through links to data provenance. Through the synthesis of two manually curated datasets, cancer treatment biomarkers from Cancer Genome Interpreter and drug-target bioactivities from Drug Target Commons, a use case shows how MediSyn effectively supports the discovery of drug-repurposing opportunities. A user study with six domain experts indicated that MediSyn benefited the drug selection and data inconsistency discovery. Though linked publication sources supported user exploration for further information, the causes of inconsistencies were not easy to find. Additionally, MediSyn could embrace more patient data to increase its informativeness. |
|
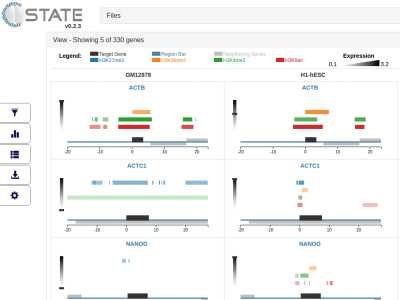
C-State: An interactive web app for simultaneous multi-gene visualization and comparative epigenetic pattern search
Divya Tej Sowpati*, Surabhi Srivastava, Jyotsna Dhawan and Rakesh Mishra Presentation Info: "Machine Learning and Medicine" session between 17:10 to 17:30 Background: Comparative epigenomic analysis across multiple genes presents a bottleneck for bench biologists working with NGS data. Despite the development of standardized peak analysis algorithms, the identification of novel epigenetic patterns and their visualization across gene subsets remains a challenge. Results: We developed a fast and interactive web app, C-State (Chromatin-State), to query and plot chromatin landscapes across multiple loci and cell types. C-State has an interactive, JavaScript-based graphical user interface and runs locally in modern web browsers that are pre-installed on all computers, thus eliminating the need for cumbersome data transfer, pre-processing and prior programming knowledge. Conclusions: C-State is unique in its ability to extract and analyze multi-gene epigenetic information. It allows for powerful GUI-based pattern searching and visualization. We include a case study to demonstrate its potential for identifying user-defined epigenetic trends in context of gene expression profiles. |