Bio+MedVis Challenge @ IEEE VIS 2024
Latest News
Bio+MedVis Challenge Program Adjusted as IEEE VIS 2024 Moves to Fully Virtual Format 16 Sep 2024
Due to the potential impacts of Hurricane Milton, IEEE VIS 2024 has transitioned to a fully virtual format to prioritize the safety of all attendees and staff. As a result, the Bio+MedVis Challenge program has been adjusted, now starting at 12:00 PM EDT on Sunday, October 13.
Bio+MedVis Challenge Program Published 16 Sep 2024
The program for the Bio+MedVis Challenge at IEEE VIS 2024 is now available! The challenge will take place on Sunday, October 13, 1:30PM - 4:30PM EDT. Check out the program for more details. We are looking forward to seeing you there!
Redesign Challenge: Redesign an Existing Visualization
Biological Background and Data Description
In biology, structure and function are tightly linked, and the biology of cells in tissues is no exception. A key challenge for cell biologists lies in understanding the spatial patterns characteristic of health and disease. While historical single-cell profiling techniques have required tissue dissociation, a cutting-edge area of cell biology research is the development and application of technologies that measure molecular states within cells while preserving the spatial context that is critical to establishing a localized picture of tissue health.
A key cellular measurement technique is called transcriptomics, which provides insight into cell types (e.g., immune cell vs. muscle cell), cell states (e.g., response to stimuli), and information about proteins that might be produced downstream (i.e., via translation). Transcriptomics techniques acquire this information by measuring gene expression: the abundance of RNA transcripts corresponding to each gene in each cell. As the name implies, spatial transcriptomics methods capture gene expression and spatial coordinates simultaneously. Resolutions of spatial transcriptomics methods can vary from subcellular, to single-cell, to “spots” that represent multiple cells. There is typically a tradeoff between the spatial resolution and the number of genes that can be measured by a given technology.
VISIUM is a spatial transcriptomics technology developed by 10x Genomics. It allows researchers to measure gene expression and spatial organization of tissues simultaneously. For a given tissue slice, VISIUM is able to measure transcripts genome-wide (e.g., ~20,000 genes for human samples) at a resolution of approximately 5-10 cells per spot. This enables researchers to understand how gene expression patterns vary across different regions of a tissue sample. This technology has applications in various fields such as cancer research, developmental biology, neuroscience, and more, allowing researchers to gain deeper insights into the molecular mechanisms underlying complex biological processes within tissues.
While each VISIUM spot represents the gene expression of multiple cells, researchers are typically interested in interpreting the data at the cell type level (e.g., linking expression differences to particular cell types that are characterized in the biological literature). As a result, computational methods have been developed to deconvolute each VISIUM spot into a distribution of (predicted) cell-type proportions. Biologists can then use the deconvolution results to link their findings to their existing cell type knowledge.
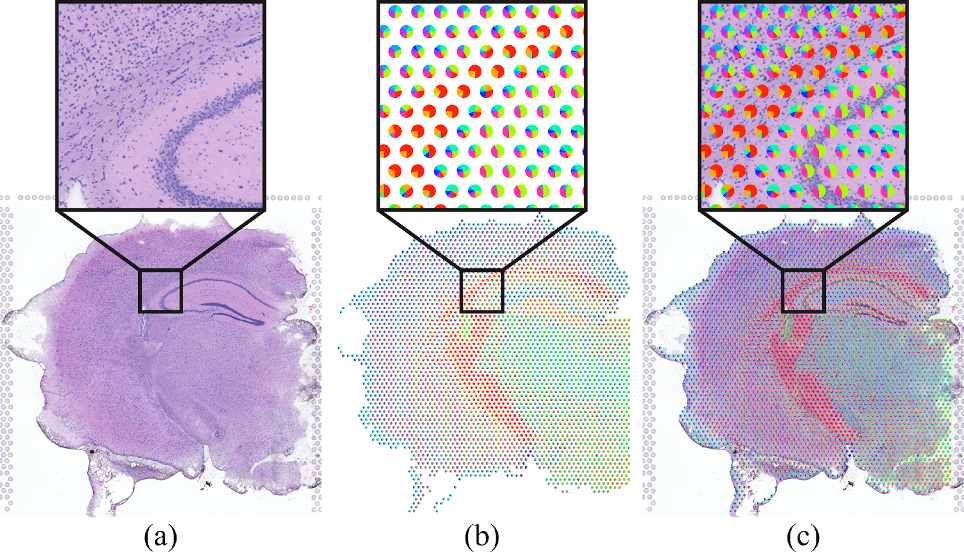
These deconvolutional methods thus produce data that, on a per-spot basis, represents proportional cell-type membership (e.g. 30% Cell Type 1, 50% Cell Type 2, 20% Cell Type 3). Visualizing these data in the context of the H&E stained tissue image provides crucial spatial context, enabling domain experts to explore deconvolution results within the intricate cellular architecture and tissue morphology. One common technique for visualizing these data is to superimpose a pie chart on each spot location representing the cell types represented. Pie charts and their limitations have been well explored by the visualization community. Moreover, superimposing them on the image occludes the underlying tissue and prevents important contextual inspection of a given spot.

Redesign Challenge Task
For this redesign task, we challenge participants to propose an alternative visualization approach that links the spot cell-type proportion to the H&E image. Submissions should consider visualization theory and principles.
Sketching and prototyping as well as fully interactive solutions will be accepted. Creativity and novelty will be considered in the evaluation.
Data and Documentation
Example Dataset
https://drive.google.com/drive/folders/1t6aeMDh2l067_6DEMFyovtRO5swZieBF?usp=sharing
Data Description
Genes.csv- List of genes in the feature matrixFeatureMatrix.mtx- Feature matrix, stored as a sparse matrixClusterGeneExpression.csv- Gene expression per cell-type clusterSpotClusterMembership.csv- Cell type proportions per spotSpotPositions.csv- Spot positions and radiusesImages/scalefactors_json.json- Scale factors between spot positionsImages/tissue_hires_image.png- H&E image
Additional Data and Resources
- Visium data from Kleshchevnikov et al., 2022: https://www.ebi.ac.uk/biostudies/arrayexpress/studies/E-MTAB-11114, filter by sample ST8059049
- Summary: https://ftp.ebi.ac.uk/biostudies/fire/E-MTAB-/114/E-MTAB-11114/Files/ST8059049_web_summary.html
- Vitessce demo of this data: http://vitessce.io/#?dataset=spatialdata-visium
- Vitessce documentation & information: http://vitessce.io/docs/
References
Kleshchevnikov, V., Shmatko, A., Dann, E. et al. Cell2location maps fine-grained cell types in spatial transcriptomics. Nat Biotechnol 40, 661–671 (2022). https://doi.org/10.1038/s41587-021-01139-4
Miller, B.F., Huang, F., Atta, L. et al. Reference-free cell type deconvolution of multi-cellular pixel-resolution spatially resolved transcriptomics data. Nat Commun 13, 2339 (2022). https://doi.org/10.1038/s41467-022-30033-z
3D Microscopy Imaging Challenge: From a RAW imaging volume to biological findings

Biological Background and Data Description
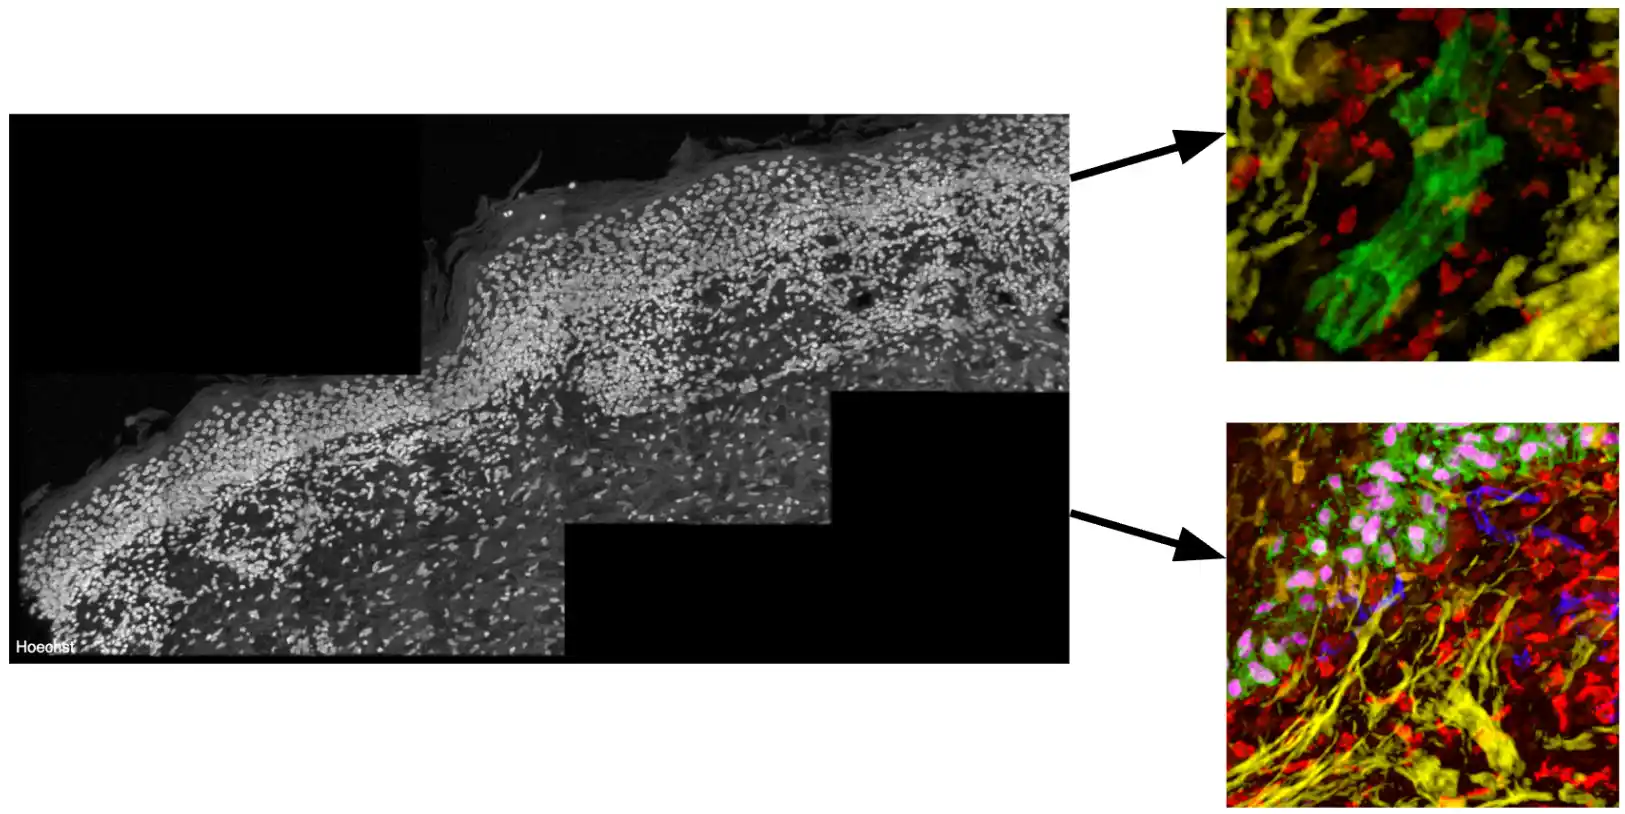
Highly multiplexed tissue imaging methods, such as Cyclic Immunofluorescence (CycIF), which allow for the analysis of over 30 biomarkers on a single tissue section, are essential tools for scientists to investigate the subcellular complexities of cancer [1]. Indeed, CyCIF has been instrumental in revealing immune-tumor interactions and the progression of melanoma at single-cell precision [2]. More recently, researchers have extended these techniques to image volumes, allowing for an even more comprehensive analysis of the diverse cell types and states within the tumor microenvironment and their spatial interactions [3]. However, effective visualization and investigation of these volumes is difficult, given their size and dimensionality. Scientists now seek new methods that can address the challenges of data occlusion and improve the process of exploring and discovering these hard-to-see interactions. The first step towards this—and the focus of this BioMedVis Challenge—is to develop algorithms that optimize camera views of Regions of Interest (ROIs) that feature important subsets of biomarkers.
Challenge Task
The starting Jupyter Notebook presents one ROI with 4 channels of interest in the dataset and a second ROI with 6 channels of interest. It is your task to find the best possible camera view configurations for a given ROI that 1) shows maximum spatial interaction of selected channels and 2) minimizes data occlusion. You can start with the first two areas given as X, Y, Z coordinates.
The following settings must be defined for each view configuration:
- Camera:
- Zoom Level
- Volume Settings:
- Translation (X, Y, Z)
- Rotation (X, Y, Z)
- Channels:
- Selection, Color, and Value Range
As a more advanced alternative, you can also try to adapt the shader code given in Vitessce to allow for more elaborate rendering operations (e.g., adaptive transparency to highlight structures of interest and reduce occlusion along the view ray).
Optimization Criteria:
You should optimize your algorithm for finding potential view configurations by having the following criteria in mind:
- Find the best possible view for the target structure of interest with minimal occlusion
- You should activate at least two channels (but you can activate as many as you see fit)
- For one target you can find multiple views
- Find the best sequence of views to show the regions of interest (ROIs) in the best possible way
Additionally, you can also:
- Find a way to navigate between the view configurations using animation
- Find a creative solution to make the ROIs visible while maintaining the context of the volume
Data and Documentation
The data volume included in this challenge represents a 194x5508x10908 volume of cancerous tissue belonging to a patient suffering from metastatic melanoma. Scientists have identified “immune niches” in this tissue, which contain specific interactions between immune cells of different types and states. Included in the data:
- 70 channels
- 2 ROI’s as examples in Jupyter
Also provided is a Jupyter Notebook (link/details), which includes all necessary starting code and information:
BioMedVis Challenge 2024.ipynb
References
[1] Lin JR, Fallahi-Sichani M, Chen JY, Sorger PK. Cyclic Immunofluorescence (CycIF), A Highly Multiplexed Method for Single-cell Imaging. Curr Protoc Chem Biol. 2016 Dec 7;8(4):251-264. doi: 10.1002/cpch.14. PMID: 27925668; PMCID: PMC5233430.
[2] Ajit J. Nirmal, Zoltan Maliga, Tuulia Vallius, Brian Quattrochi, Alyce A. Chen, Connor A. Jacobson, Roxanne J. Pelletier, Clarence Yapp, Raquel Arias-Camison, Yu-An Chen, Christine G. Lian, George F. Murphy, Sandro Santagata, Peter K. Sorger; The Spatial Landscape of Progression and Immunoediting in Primary Melanoma at Single-Cell Resolution. Cancer Discov 1 June 2022; 12 (6): 1518–1541. doi: 10.1158/2159-8290.CD-21-1357
[3] Yapp C, Nirmal AJ, Zhou F, Maliga Z, Tefft JB, Llopis PM, Murphy GF, Lian CG, Danuser G, Santagata S, Sorger PK; Human Tumour Atlas Network. Multiplexed 3D Analysis of Immune States and Niches in Human Tissue. bioRxiv [Preprint]. 2024 Mar 28:2023.11.10.566670. doi: 10.1101/2023.11.10.566670. PMID: 38014052; PMCID: PMC10680601.
Submission
Submissions will be considered for talk or poster presentations. Please send a two-page PDF abstract with up to 5 additional figures and a draft of your proposed poster (max 10MB) to PCS: new.precisionconference.com/submissions. The abstract should include:
- aspects of the figure identified as needing improvement or clarification,
- justification of encoding and design choices,
- at least one or more images of your design
- optional: a video or screencast to explain the visual encoding
Selected submissions will be invited for talk presentations during the Bio+MedVis session at the IEEE VIS 2024 conference.
Evaluation of Submissions
All submissions will be thoroughly reviewed by at least two reviewers, coming from the challenge chairs and selected domain experts. All accepted submissions will be published in the conference proceedings. Winning designs may be invited to become a plugin or extension to Vitessce.
Program
See the program for more details.
Important dates
- Submission: August 23, 2024
- Notification: August 29, 2024
- Camera-ready version: September 5, 2024
- Bio+MedVis Challenge event: October 13, 2024
Questions?
Please feel free to ask questions at: biovis_challenge@ieeevis.org.
The chairs of the Bio+MedVis Challenge @ IEEE VIS 2024:
- Barbora Kozlikova, Masaryk University, Czech Republic
- Nils Gehlenborg, Harvard Medical School, USA
- Laura Garrison, University of Bergen, Norway
- Eric Mörth, Harvard Medical School, USA
- Simon Warchol, Harvard University, USA
- Morgan Turner, Harvard Medical School, USA