Bio+MedVis Challenge @ IEEE VIS 2025
Sunday, November 2, 2025, 9:00 AM - 12:30 PM (CET)
Keynote Talk

From Rendering to Reasoning: Evolving Visualization for Life Sciences
Stefan Bruckner, Professor, Chair of Visual Analytics, University of Rostock, Germany.
Talk Abstract: In the past decades, visualization in the life sciences has matured from a focus on making images to a deeper mission of making sense. In this talk, I examine this evolution through the lens of human-computer collaboration: how we moved from raw rendering, to interpretable visual representation, to interactive co-exploration, and finally to reasoning and communication at scale. Along this trajectory, visualization has expanded its role from a technical enabler of data display to an intellectual partner in discovery and decision-making. The talk highlights key milestones, examples, and open challenges that illustrate how visualization increasingly serves as a medium for shared reasoning between humans, data, and intelligent systems.
Program
View the program and submissions here.
Challenges
Redesign Challenge: Redesign an Existing Visualization
Background and Data Description
With 1 in 3 people affected, neurological conditions are the leading cause of illness and disability worldwide, per the World Health Organization [1]. Early detection and diagnosis of such conditions that include Alzheimer’s or Parkinson’s disease are key to treatment and improved patient outcomes. Acquisition methods alongside standard imaging methods such as magnetic resonance imaging (MRI), are essential to support clinical researchers and point-of-care medical staff. Such methods are often capable of detecting subtle biochemical changes marking neurological abnormalities unidentifiable in medical imaging.
Magnetic resonance spectroscopy (MRS) is one such acquisition method, allowing for non-invasive assessment of tissue biochemistry that is essential for tumor and radiotherapy studies in addition to early detection of other neurodegenerative disorders.
While magnetic resonance imaging (MRI) produces a stack of high-resolution anatomical images, MRS trades spatial for chemical information to produce a spectral graph of localized concentrations of biochemical compounds known as metabolites. Metabolites are indicated as one or multiple peaks of varying signal intensities on the spectral graph, arranged by resonance frequency due to the properties of the atomic nucleus used for the study. Generally speaking, every metabolite can be identified by its chemical shift, i.e., its difference in resonance frequency relative to a particular reference metabolite.
While hydrogen (1H) MRS is common, phosphorus (31P) is particularly useful in cases where clinicians are interested in questions related to cellular metabolism and oxidative stress, which are markers for a range of neuropathological conditions [3]. Although these technologies have been available for several years, technological advances are yielding new opportunities to explore the metabolic changes in brain development and aging, which in turn could yield new therapeutic approaches.
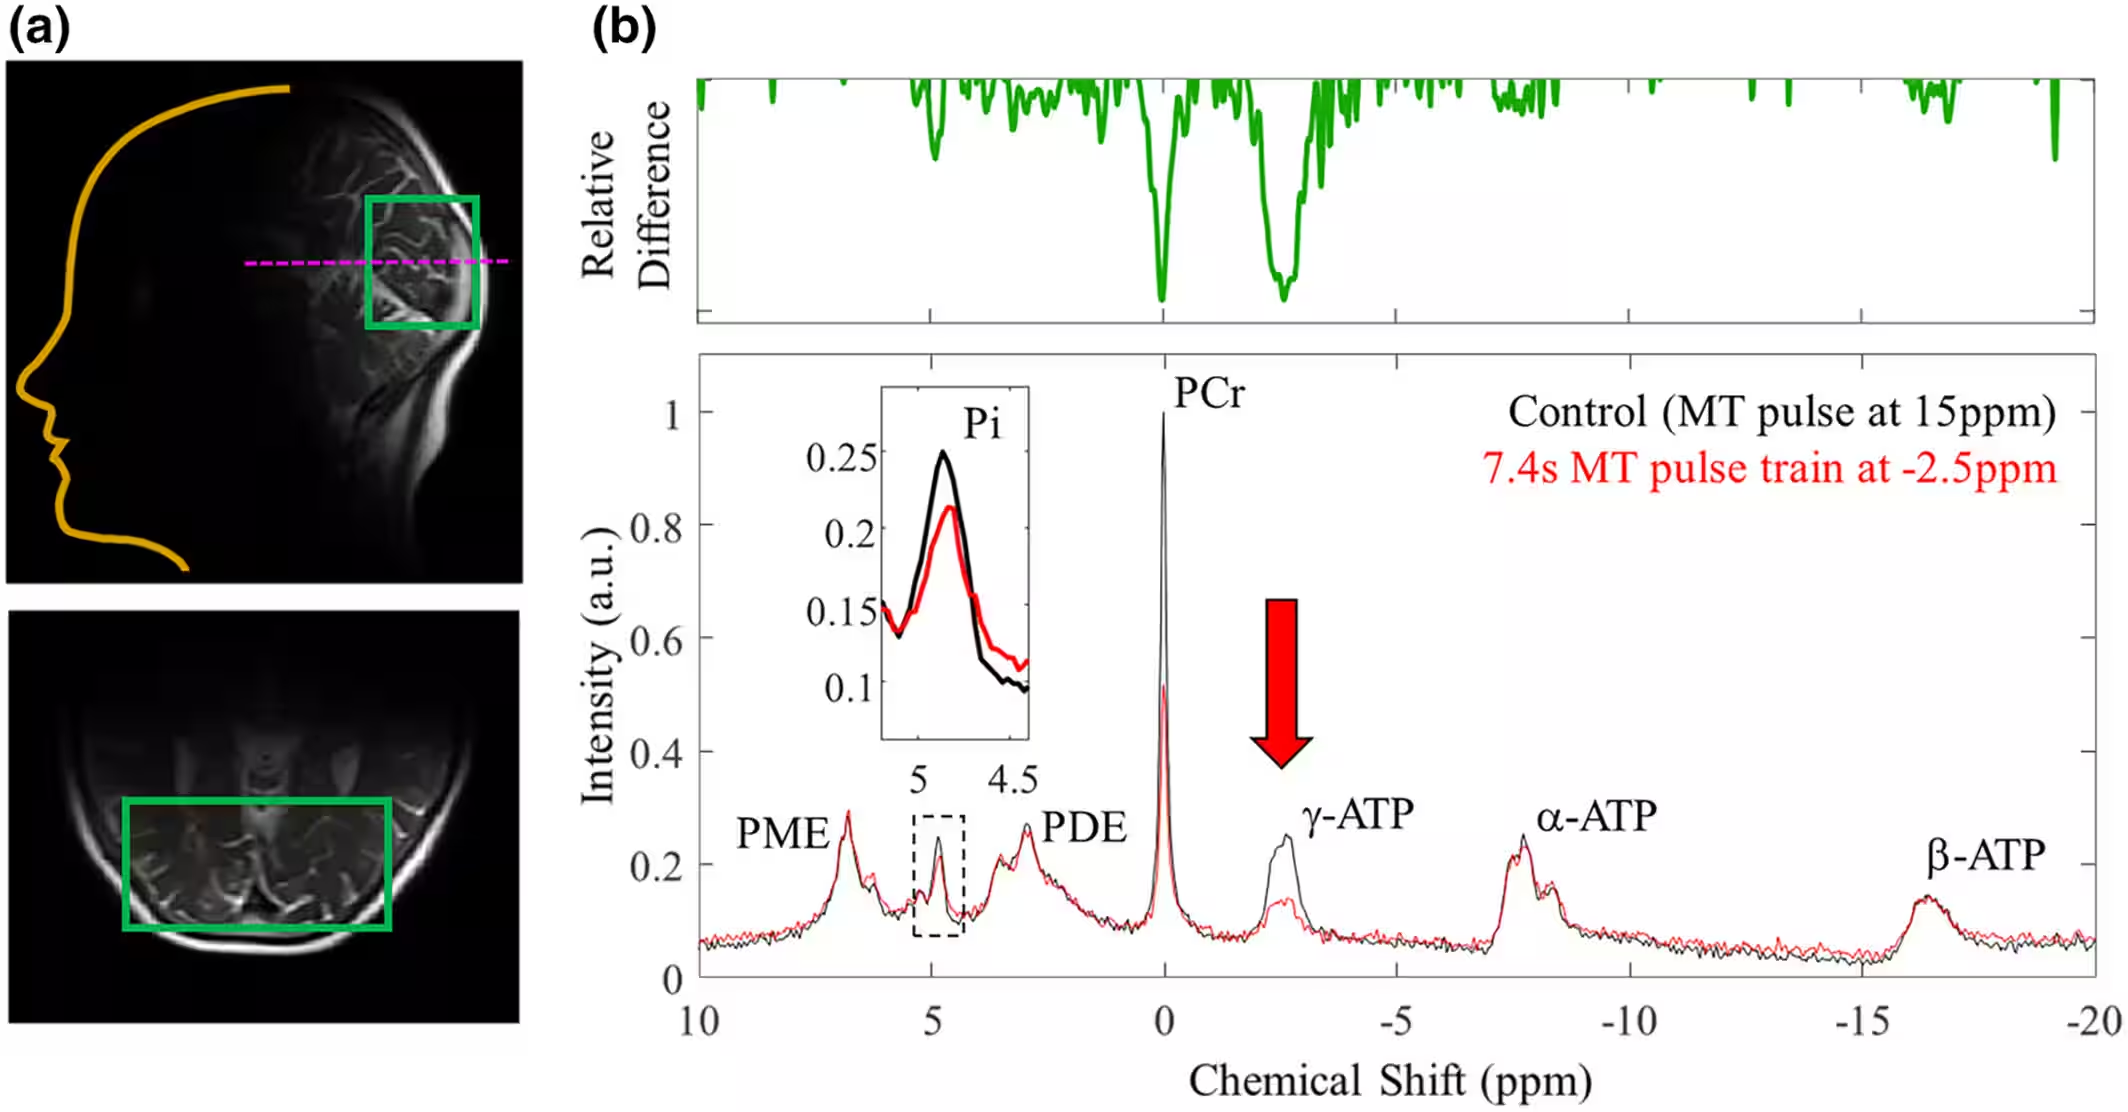
Illustrated below in Fig. 1, 31P-MRS is captured per-voxel with a structural MR image that provides essential context for the location of each spectral voxel. Following acquisition, model fitting and spectral quantification in standard analysis tools results in a single spectral output graph containing approximately 10 or fewer spectral peaks. Visualization standard practice for this data is often limited to drawing the spectral graph, and the learning curve to interpreting such data is steep – even in a successful acquisition, spectral peaks can be difficult to identify and meaningful relationships are difficult to understand. It is additionally important to clearly communicate the presence of possible error or outliers to help researchers and clinicians understand whether these issues arise from problems with data acquisition and processing, or if, in the case of outliers, further exploration is meaningful. These challenges are largely unmet in current clinical tools, and within the visualization community research has mainly focused on 1H-MRS with different clinical considerations [6,7]. It is difficult for researchers to learn to interpret these data, let alone to interactively compare relative biochemical concentrations between patients or at different times to understand metabolic changes or oxidative stress.
Redesign Challenge Task
For this redesign task, we challenge participants to propose an alternative visualization approach that better enables clinicians and MRS researchers to explore, analyze, and/or communicate these data in a more facile manner, for instance to answer questions like:
- How to more easily identify metabolites within a spectrum?
- How to assess the quality of a spectrum, e.g., according to peak shape(s)?
- How to compare peaks in a spectrum within and across subjects? These peaks are usually measured in terms of their amplitudes, or the area-under-the-peak.
- How to identify, compare and summarize ratio values (often with phosphocreatine as the base comparison) between peaks in an intuitive way?
Submissions should consider visualization theory and principles. Most essential to this challenge is the exploration of creative, novel ideas for this data and associated tasks—as such, sketching and prototyping as well as fully interactive solutions are welcome!
Data and Documentation
Example Dataset
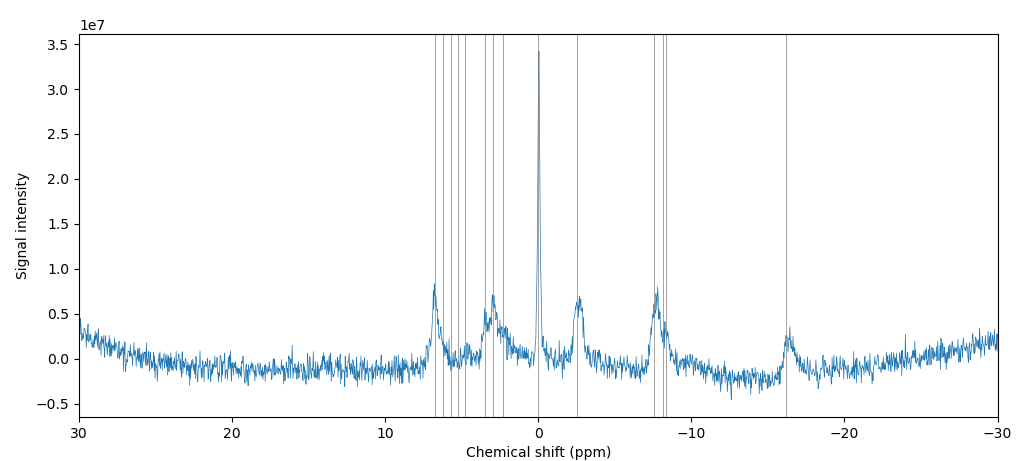
The provided dataset includes 18 spectral outputs, one of which is illustrated in Fig 2. Each peak in this figure corresponds to a metabolite, for example, phosphocreatine is the tall peak centered at approximately 0.0 parts per million. The below table lists the more commonly-assessed metabolites and their chemical shifts. Note that some metabolites have multiple peaks, e.g., DPG:
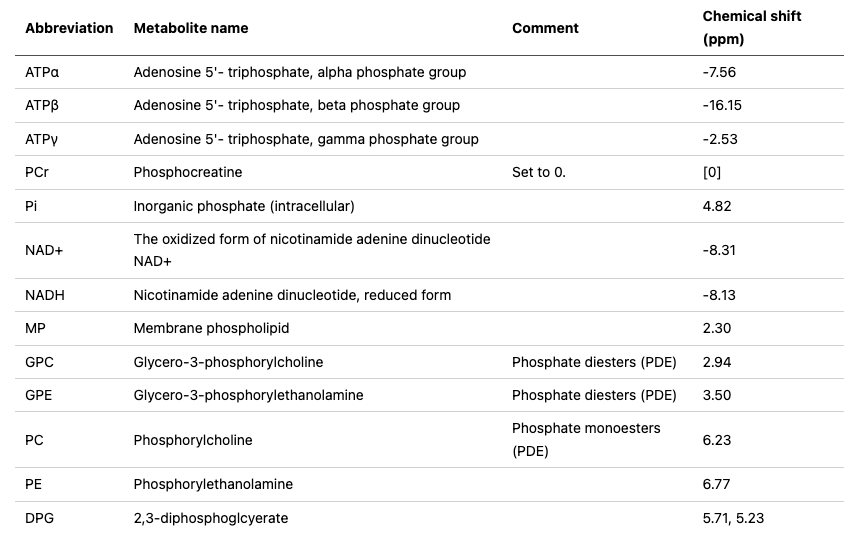
For a detailed table of other metabolites and their chemical shifts, we refer to Deelchand et al. [8].
Data Description
The processed dataset for the redesign challenge is available for download at the BioMed+Vis 2025 Redesign Challenge GitLab.
The dataset we provide includes 18 pre-processed spectra. The spectra are split into two csv files:
spectra.csv: Each spectrum is a 2048 x 1 vector that represents the measured amplitude of a given metabolite at a given chemical shift for a single subject. There are 18 vectors for a total array size of 2048 x 18. These vectors represent the spectra for 9 individuals, all at the same voxel position with samples at two time points. The arrangement is such thatspectra[:,0]andspectra[:,1]belong to Subject00 at t0 and t1 respectively,spectra[:,2]andspectra[:,3]belong to Subject01 at t0 and t1, etc.chemical_shifts.csv: All spectra from spectra.csv align with this 2048 x 1 vector that indicates the chemical shift (x-axis in Fig. 2). The chemical shifts of metabolites are usually referenced to Phosphocreatine (PCr) as an internal standard at 0.0 ppm.
For a bit more background on 31P-MRS, [9] and [10] provide a friendly orientation to this kind of data. To see some of the types of work from the visualization community for this kind of data, [6] and [7] are useful starting points.
The full dataset for those interested in a (much) deeper dive is available here: 31P MRS Participants 1-10 [4].
References and Further Resources on 31P-MRS
[1] World Health Organization. Over 1 in 3 people affected by neurological conditions, the leading cause of illness and disability worldwide (2024).
[2] S. Ulmer, M. Backens, and F. J. Ahlhelm. Basic principles and clinical applications of magnetic resonance spectroscopy in neuroradiology. Journal of Computer Assisted Tomography, 40(1):1–13, 2016. doi: 10.1097/RCT.0000000000000322
[3] M. Van Der Graaf. In vivo magnetic resonance spectroscopy: Basic methodology and clinical applications. European Biophysics Journal, 39(4):527–540 (2010). Doi: 10.1002/9780470882221
[4] Fear, E. J., Torkelsen, F. H., Zamboni, E., Chen, K. J., Scott, M., Jeffery, G., … & Kennerley, A. J. (2023). Use of 31P magnetisation transfer magnetic resonance spectroscopy to measure ATP changes after 670 nm transcranial photobiomodulation in older adults. Aging Cell, 22(11), e14005. Data: Fear, Elizabeth; Kennerley, Aneurin (2023), “31P MRS MT Participants 1-10”, Mendeley Data, V1, doi: 10.17632/3r7kmfmpyj.1
[5] Jett, S., Boneu, C., Zarate, C., Carlton, C., Kodancha, V., Nerattini, M., … & Mosconi, L. (2023). Systematic review of 31P-magnetic resonance spectroscopy studies of brain high energy phosphates and membrane phospholipids in aging and Alzheimer’s disease. Frontiers in Aging Neuroscience, 15, 1183228.
[6] Nunes, M., Laruelo, A., Ken, S., Laprie, A., & Bühler, K. (2014, September). A Survey on Visualizing Magnetic Resonance Spectroscopy Data. In VCBM (pp. 21-30).
[7] Garrison, L., Vašíček, J., Craven, A. R., Grüner, R., Smit, N. N., & Bruckner, S. (2020). Interactive visual exploration of metabolite ratios in MR spectroscopy studies. Computers & Graphics, 92, 1-12. Accompanying github repository and tool: https://github.com/lauragarrison87/spectramosaic-public .
[8] Deelchand, D. K., Nguyen, T. M., Zhu, X. H., Mochel, F., & Henry, P. G. (2015). Quantification of in vivo 31P NMR brain spectra using LCModel. NMR in Biomedicine, 28(6), 633-641.
[9] MRS Hub: Compiled list of MRS quantification and visualization software
[10] Why Phosphorus? Questions and answers in MRI
3D Microscopy Imaging Challenge: From a RAW imaging volume to biological findings
Adapted by Clarence Yapp, 2024.
Biological Background and Data Description
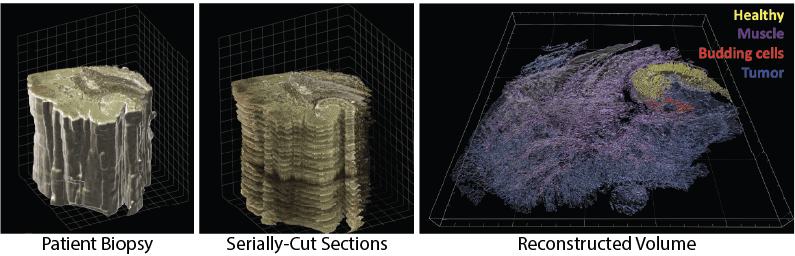
Highly multiplexed tissue imaging methods, such as Cyclic Immunofluorescence (CycIF), which allow for the analysis of over 30 biomarkers on a single tissue section, are essential tools for scientists to investigate the subcellular complexities of cancer [1]. Indeed, CyCIF has been instrumental in revealing immune-tumor interactions and the progression of melanoma at single-cell precision [2]. More recently, researchers have extended these techniques to image volumes, allowing for an even more comprehensive analysis of the diverse cell types and states within the tumor microenvironment and their spatial interactions [3]. These volumes enable cancer biologists and pathologists to explore hypotheses derived from 2D tissue images with enhanced detail and rigor, facilitating deeper insights into cellular dynamics within the tumor microenvironment. This approach allows them to examine the location and extent of specific cell-cell interactions within a given volume. However, identifying, visualizing, and analyzing these intricate interactions across volumes is a challenging task, both computationally and visually. The focus of this BioMedVis Challenge, therefore, is to develop algorithms and visualization techniques that help experts search for and identify such cell-cell interactions, as indicated by the presence of cells expressing certain biomarkers.
Challenge Task
The starting Jupyter notebook presents several combinations of biomarkers that represent known cell-cell interactions. We demonstrate how specific cells can be determined based on the presence of these biomarkers. It is your task to identify and visualize where such interactions occur within the tissue, both globally and locally.
Participants must thus:
- Develop an algorithm for identifying ROIs where cells expressing specific combinations of markers exist within the tissue volume.
- Visualizing these ROIs at a global scale, helping experts assess the extent to which such interactions occur and the broad morphological regions in which these interactions are occurring.
- Allow users to dig into specific ROIs at the cellular level.
In doing so, participants may choose to augment existing volumetric visualization techniques or propose peripheral abstract visualizations. When visualizing the volume, they may choose to identify view configurations of the following form:
- Camera:
- Zoom Level
- Volume Settings:
- Translation (X, Y, Z)
- Rotation (X, Y, Z)
- Channels:
- Selection, Color, and Value Range
Data and Documentation
The data volume included in this challenge represents a 194x5508x10908 volume of cancerous tissue belonging to a patient suffering from metastatic melanoma. Scientists have identified “immune niches” in this tissue, which contain specific interactions between immune cells of different types and states.
Also provided is a Jupyter Notebook (link/details), which includes a sample dataset and some notable cell-cell interactions. This notebook uses Vitessce, which participants are welcome to build on, though they may also develop their own visualization/visual analytics systems or build on other systems.
Jupyter notebook: BioMedVis Challenge 2025.ipynb
**UPDATE 7/16/25: ** The dataset for the 3D Microscopy Imaging Challenge is now available at: s3://lsp-public-data/biomedvis-challenge-2025
AWS Bucket: s3://lsp-public-data/biomedvis-challenge-2025/ or https://lsp-public-data.s3.amazonaws.com/biomedvis-challenge-2025/
Access Instructions: We recommend accessing the data directly in Zarr format, as demonstrated in the Notebook
Alternatively, you can browse and download files via the AWS CLI:
aws s3 ls s3://lsp-public-data/biomedvis-challenge-2025/
aws s3 cp s3://lsp-public-data/biomedvis-challenge-2025/README.md .
or using Cyberduck.
References
[1] Lin JR, Fallahi-Sichani M, Chen JY, Sorger PK. Cyclic Immunofluorescence (CycIF), A Highly Multiplexed Method for Single-cell Imaging. Curr Protoc Chem Biol. 2016 Dec 7;8(4):251-264. doi: 10.1002/cpch.14. PMID: 27925668; PMCID: PMC5233430.
[2] Ajit J. Nirmal, Zoltan Maliga, Tuulia Vallius, Brian Quattrochi, Alyce A. Chen, Connor A. Jacobson, Roxanne J. Pelletier, Clarence Yapp, Raquel Arias-Camison, Yu-An Chen, Christine G. Lian, George F. Murphy, Sandro Santagata, Peter K. Sorger; The Spatial Landscape of Progression and Immunoediting in Primary Melanoma at Single-Cell Resolution. Cancer Discov 1 June 2022; 12 (6): 1518–1541. doi: 10.1158/2159-8290.CD-21-1357
[3] Yapp C, Nirmal AJ, Zhou F, Maliga Z, Tefft JB, Llopis PM, Murphy GF, Lian CG, Danuser G, Santagata S, Sorger PK; Human Tumour Atlas Network. Multiplexed 3D Analysis of Immune States and Niches in Human Tissue. bioRxiv [Preprint]. 2024 Mar 28:2023.11.10.566670. doi: 10.1101/2023.11.10.566670. PMID: 38014052; PMCID: PMC10680601.
Submission
Submissions for either the redesign or the main challenge will be considered for talk or poster presentations. Please send a two-page PDF abstract with up to 5 additional figures to PCS: new.precisionconference.com/submissions. Your submission should use the VGTC conference two-column format. Your submission should include:
- a thorough description and justification of your visualization (and analysis) techniques–use the space to describe your approach, and keep background and data detail descriptions to a minimum.
- at least one or more images of your visualization
- Highly encouraged: a video or screencast to explain your visualization approach (should not exceed five minutes)!
Selected submissions will be invited for talk presentations during the Bio+MedVis session at the IEEE VIS 2025 conference.
Evaluation of Submissions
All submissions will be evaluated by at least two reviewers, coming from the challenge chairs and selected domain experts. All accepted submissions will be published in the conference proceedings.
Strong, creative submissions have the potential for recognition with an Award of Merit or an Award of Excellence.
Awards, at the discretion of evaluators, may be given according to the primary author’s status as a Student (BSc/MSc) or Researcher/Professional (PhD and up). In the case of many submissions, Challenge organizers may further subdivide these status categories to better weigh the contribution against the experience of the submitters.
Important dates
- Submission (extended): August 22, 2025 Anywhere On Earth
- Notification: September 5, 2025
- Camera-ready version: September 26, 2025
- Bio+MedVis Challenge event: November 2, 2025
Questions?
Please feel free to send any questions to: biovis_challenge@ieeevis.org.
Chairs of the Bio+MedVis Challenge @ IEEE VIS 2025:
- Laura Garrison, University of Bergen, Norway
- Katarina Furmanova, Masaryk University, Czech Republic
- Simon Warchol, Harvard University, USA