Papers BioVis@VIS
Attended BioVis@VIS 2016? Please fill out our survey and tell us what you thought!
|
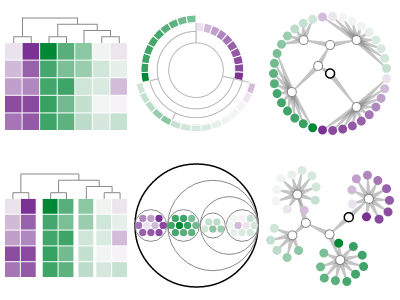
Paper: Unboxing Cluster Heatmaps
Sophie Engle*, Sean Whalen, Alark Joshi, Katherine Pollard
Background: Cluster heatmaps are commonly used in biology and related fields to reveal hierarchical clusters in data matrices. This visualization technique has high data density and reveal clusters better than unordered heatmaps alone. However, cluster heatmaps have known issues making them both time consuming to use and prone to error. We hypothesize that visualization techniques without the rigid grid constraint of cluster heatmaps will perform better at clustering-related tasks. Results: We developed an approach to "unbox" the heatmap values and embed them directly in the hierarchical clustering results, allowing us to use standard hierarchical visualization techniques as alternatives to cluster heatmaps. We then tested our hypothesis by conducting a survey of 45 practitioners to determine how cluster heatmaps are used, prototyping alternatives to cluster heatmaps using pair analytics with a computational biologist, and evaluating those alternatives with hour-long interviews of 5 practitioners and an Amazon Mechanical Turk user study with approximately 200 participants. We found statistically significant performance differences for most clustering-related tasks, and in the number of perceived visual clusters. Visit git.io/vw0t3 for our results. Conclusions: The optimal technique varied by task. However, gapmaps were preferred by the interviewed practitioners and outperformed or performed as well as cluster heatmaps for clustering-related tasks. Gapmaps are similar to cluster heatmaps, but relax the heatmap grid constraints by introducing gaps between rows and/or columns that are not closely clustered. Based on these results, we recommend users adopt gapmaps as an alternative to cluster heatmaps. |
|
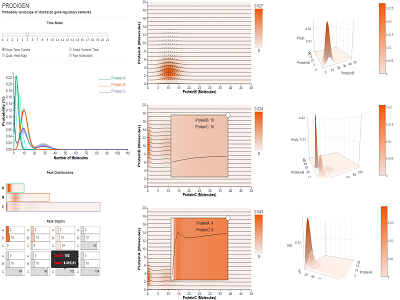
Paper: PRODIGEN: Visualizing the Probability Landscape of Stochastic Gene Regulatory Networks in State and Time Space
Chihua Ma*, Timothy Luciani, Anna Terebus, Jie Liang, G.Elisabeta Marai
Background: Visualizing the complex probability landscape of stochastic gene regulatory networks can further biologists understanding of phenotypic behavior associated with specific genes. Results: We present PRODIGEN (PRObability DIstribution of GEne Networks), a web-based visual analysis tool for the systematic exploration of probability distributions over simulation time and state space in such networks. PRODIGEN was designed in collaboration with bioinformaticians who research stochastic gene networks. The analysis tool combines in a novel way existing, expanded, and new visual encodings to capture the time-varying characteristics of probability distributions: spaghetti plots over one dimensional projection, heatmaps of distributions over 2D projections, enhanced with overlaid time curves to display temporal changes, and novel individual glyphs of state information corresponding to particular peaks. Conclusions: We demonstrate the effectiveness of the tool through two case studies on the computed probabilistic landscape of a gene regulatory network and of a toggle-switch network. Domain expert feedback indicates that our visual approach can help biologists: 1) visualize probabilities of stable states, 2) explore the temporal probability distributions, and 3) discover small peaks in the probability landscape that have potential relation to specific diseases. |
|
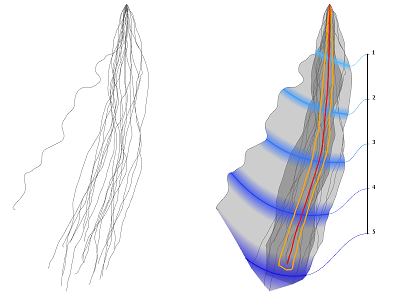
Paper: Generalized Box-Plot for Root Growth Ensembles
Viktor Vad*, Douglas Cedrim, Wolfgang Busch, Peter Filzmoser, Ivan Viola
Background: In the field of root biology there has been a remarkable progress in root phenotyping, which is the efficient acquisition and quantitative description of root morphology. What is currently missing are means to efficiently explore, exchange and present the massive amount of acquired, and often time dependent root phenotypes. Results: In this work, we present visual summaries of root ensembles by aggregating root images with identical genetic characteristics. We use the generalized box plot concept with a new formulation of data depth. In addition to spatial distributions, we created a visual representation to encode temporal distributions associated with the development of root individuals. Conclusions: The new formulation of data depth allows for much faster implementation close to interactive frame rates. This allows us to present the statistics from bootstrapping that characterize the root sample set quality. As a positive side effect of the new data-depth formulation we are able to define the geometric median for the curve ensemble, which was well received by the domain experts. |
|
Paper: A Taxonomy of Visualization Tasks for the Analysis of Biological Pathway Data
Paul Murray*, Fintan McGee, Angus Forbes
Background: Understanding complicated networks of interactions and chemical components is essential to solving contemporary problems in modern biology, especially in domains such as cancer and systems research. In these domains, biological pathway data is used to represent chains of interactions that occur within a given biological process. Visual representations can help researchers understand, interact with, and reason about these complex pathways in a number of ways. At the same time, these datasets offer unique challenges for visualization, due to their complexity and heterogeneity. Results: Here, we present taxonomy of tasks that are regularly performed by researchers who work with biological pathway data. The generation of these tasks was done in conjunction with interviews with several domain experts in biology. These tasks require further classification than is provided by existing taxonomies. We also examine existing visualization techniques that support each task, and we discuss gaps in the existing visualization space revealed by our taxonomy. Conclusions: Our taxonomy is designed to support the development and design of future biological pathway visualization applications. We conclude by suggesting future research directions based on our taxonomy and motivated by the comments received by our domain experts. |
|
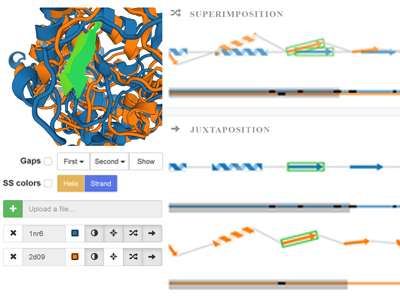
Paper: Comparative Visualization of Protein Secondary Structures
Lucia Kocincova, Miroslava Jaresova*, Jan Byska, Julius Parulek, Helwig Hauser, Barbora Kozlikov
Background: Protein function is determined by many factors, namely by its constitution, spatial arrangement, and dynamic behavior. Studying these factors helps the biochemists and biologists to better understand the protein behavior and to design proteins with modifi ed properties. One of the most common approaches to these studies is to compare the protein structure with other molecules and to reveal similarities and di fferences in their polypeptide chains. Results: We support the comparison process by proposing a new visualization technique that bridges the gap between traditionally used 1D and 3D representations. By introducing the information about mutual positions of protein chains into the 1D sequential representation the users are able to observe the spatial diff erences between the proteins without any occlusion commonly present in 3D view. Our representation is designed to serve namely for comparison of multiple proteins or a set of time steps of molecular dynamics simulation. Conclusions: The novel representation is demonstrated on two case studies. The first study aims to compare a set of proteins from the family of cytochromes P450 where the position of the secondary structures has a signifi cant impact on the substrate channeling. The second study focuses on the protein flexibility when by comparing a set of time steps our representation helps to reveal the most dynamically changing parts of the protein chain. |
|
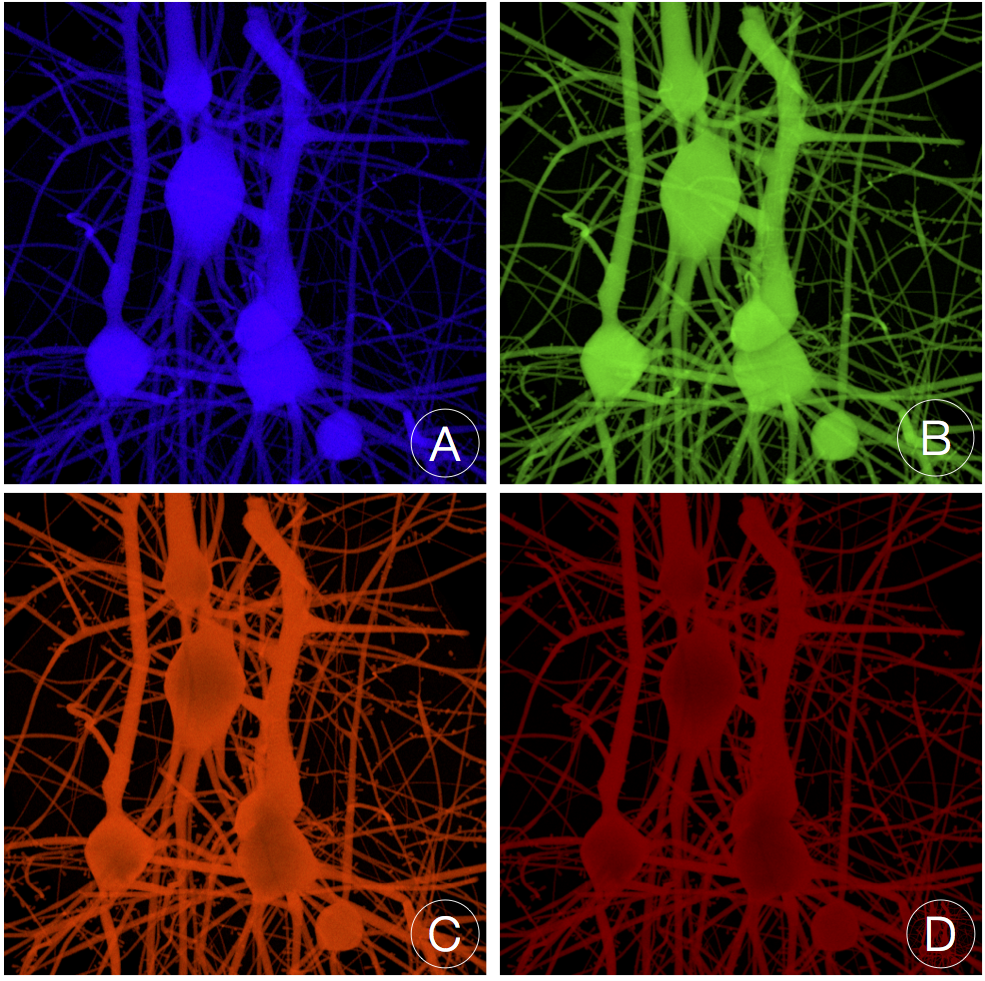
Paper: Bio-physically Plausible Visualization of Highly Scattering Fluorescent Neocortical Models for in Silico Experimentation
Marwan Abdellah*, Ahmet Bilgili, Stefan Eilemann, Julian Shillcock, Henry Markram, Felix Schurmann
Background: We present a visualization pipeline capable of accurate rendering of highly scattering fluorescent neocortical neuronal models. The pipeline is mainly developed to serve the computational neurobiology community. It allows the scientists to visualize the results of their virtual experiments that are performed in computer simulations, or in silico. The impact of the presented pipeline opens novel avenues for assisting the neuroscientists to build biologically accurate models of the brain. These models result from computer simulations of physical experiments that use fluorescence imaging to understand the structural and functional aspects of the brain. Due to the limited capabilities of the current visualization workflows to handle fluorescent volumetric datasets, we propose a physically-based optical model that can accurately simulate light interaction with fluorescent-tagged scattering media based on the basic principles of geometric optics and Monte Carlo path tracing. We also develop an automated and efficient framework for generating dense fluorescent tissue blocks from a neocortical column model that is composed of approximately 31000 neurons. Results: Our pipeline is used to visualize a virtual fluorescent tissue block of 50 m 3 that is reconstructed from the somatosensory cortex of juvenile rat. The fluorescence optical model is qualitatively analyzed and validated against experimental emission spectra of different fluorescent dyes from the Alexa Fluor family. Keywords: Modeling and Simulation; Highly Scattering Volumes; Fluorescence Rendering and Visualization; Neocortical Brain Models; In Silico Neuroscience AMS Subject Classification: Modelling and Simulation |
|
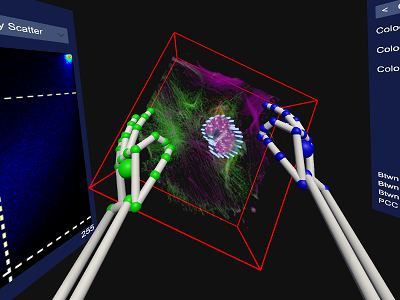
Paper: Virtual Reality Assisted Microscopy Data Visualization and Colocalization Analysis
Rensu Theart*, Ben Loos, Thomas Niesler
Background: Confocal microscopes deliver detailed three-dimensional data and are instrumental in biological analysis and research. Usually, this three-dimensional data is rendered as a projection onto a two-dimensional display. We describe a system for rendering such data using a modern virtual reality (VR) headset. Sample manipulation is possible by fully-immersive hand-tracking and also by means of a conventional gamepad. We apply this system to the specific task of colocalization analysis, an important analysis tool in biological microscopy. We evaluate our system by means of a set of user trials. Results: The user trials show that, despite inaccuracies which still plague the hand tracking, this is the most productive and intuitive interface. The inaccuracies nevertheless lead to a perception among users that productivity is low, resulting in a subjective preference for the gamepad. Fully-immersive manipulation was shown to be particularly effective when defining a region of interest (ROI) for colocalization analysis. Conclusions: Virtual reality offers an attractive and powerful means of visualization for microscopy data. Fully immersive interfaces using hand tracking show the highest levels of intuitiveness and consequent productivity. However, current inaccuracies in hand tracking performance still lead to a disproportionately critical user perception. |
|
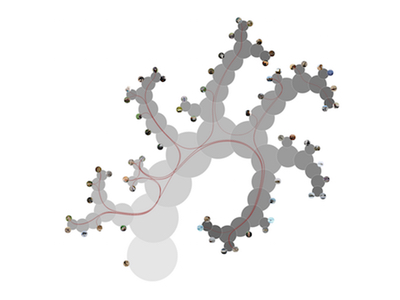
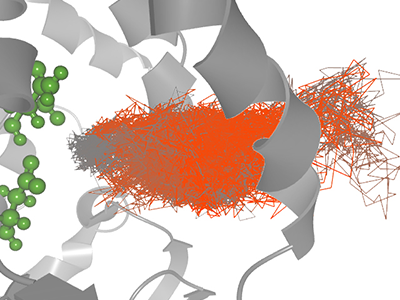
Paper: Interactive Exploration of Ligand Transportation through Protein Tunnels
Katarina Furmanova*, Miroslava Jaresova, Jan Byska, Adam Jurcik, Julius Parulek, Helwig Hauser, Barbora Kozlikova
Background: Protein structures and their interaction with ligands have been in the focus of biochemistry and structural biology research for decades. The transportation of ligand into the protein active site is often complex process, driven by geometric and physico-chemical properties, which renders the ligand path full of jitter and impasses. This prevents understanding of the ligand transportation and reasoning behind its behavior along the path. Results: To address the needs of the domain experts we design an explorative visualization solution based on a multi-scale simplification model. It helps to navigate the user to the most interesting parts of the ligand trajectory by exploring different attributes of the ligand and its movement, such as its distance to the active site, changes of amino acids lining the ligand, or ligand "stuckness". The process is supported by three linked views -- 3D representation of the simplified trajectory, scatterplot matrix, and bar charts with line representation of ligand-lining amino acids. Conclusions: The usage of our tool is demonstrated on molecular dynamics simulations provided by the domain experts. The tool was tested by the domain experts from protein engineering and the results confirm that it helps to navigate the user to the most interesting parts of the ligand trajectory and to understand the ligand behavior. |