Design Contest (BioVis@Vis)
Attended BioVis@VIS 2016? Please fill out our survey and tell us what you thought!
Motivation
Many decisions on uncertain events are made based on the likelihood inferred from data of limited validity. The uncertainty is often expressed in numerical form as frequencies or probabilities. However, they are notoriously difficult to communicate effectively. Studies have shown both laymen and professionals have trouble understanding risk information involving conditional probabilities and Bayesian reasoning [1-6, 9].
Please see the problems proposed for the Design Contest as well as the accepted submissions below:
Call of Participation
Keywords: Bayesian Reasoning, Conditional Probability, Visual Communication
Contest Challenge
This year’s design contest focuses on the visual communication of conditional probabilities, such as the communication of risk.
The contest is aimed at the exploration of the visual representations to communicate, or to support the communication of, risks in Bayesian reasoning tasks. Previous studies have found that the ability of people to solve Bayesian problems depends on the way the information is conveyed [2]. In this contest, a special emphasis is laid on the design of visual aids.
For this challenge, we picked two Bayesian reasoning tasks: the classic mammography problem [3] and an example from a prenatal test brochure for Down Syndrome [2]. Participants are asked to design visual solutions for both tasks. We supply a scenario to provide a context to design your visual solutions, and a text and a target question for each task.
Consider following questions:
- What does it mean to have a positive test result in a screening test?
- What is the best way to communicate a test result so a patient will understand it?
- For the second task, consider how the prevalence (epidemiological parameters) affects the predictive power of the screening test.
Accepted entries will be asked to present during the poster session of BioVis at the IEEE VIS conference (October 24th, 2016).
Scenario:
Imagine you are a reporter for a general interest health magazine. You want to design a figure to explain the texts you received from a doctor so that the reader of your article will be able to answer the target question. You are particularly interested in the question of what it means when one receives a positive screening test result. This probability is also known as the positive predictive value of a test.
Two scenarios were provided to contests for Mammography and Down Syndrome screening
Submission
We have provided links to a template (in various paper sizes) to prepare your submission. The contents of your submission can be prepared digitally or sketched by hand. We are interested in seeing your design process more than a polished, finished article, so the template will provide space for you to share early concepts, details of how you approach this problem, and justification or evaluation of your design choices, as well as for suggested solutions.
You may work individually or in team, but one contestant can represent only one submission. The submission deadline is September 23, 2016. Please submit your entry digitally by sending to design@biovis.net. You may send digitally prepared images or scanned images using the provided template. Please make sure the images are at a reasonable resolution (at least 150 dpi). If you have any questions with regard to preparing your submission, please contact us via design@biovis.net.
Judging
The design contest organisers will review your submission and send a notification of results of first review cycle. For those accepted submissions, the contestant will have a chance to present your design during a poster session, and conference attendees will have a chance to vote for their favourite design. Domain experts (statistics and visualization) will also evaluate your submission, giving a weighted score. The scores from the experts and attendees’ votes will be added up to award the winner and the runner-up.
Templates
Please use the following templates as a guide. You may adjust the proportion of the final design and the design process, but please do not exceed the overall space provided.
Terms and Conditions
By submitting an entry, you give the BioVis 2016 organizers permission to publish it in conference-related materials (web site, proceedings, companion papers marketing). Any usage or reference to any submission will include full credit to its authors.
References
[1] K. Binder, S. Krauss, and G. Bruckmaier, “Effects of visualizing statistical information – an empirical study on tree diagrams and 2 × 2 tables,” Front. Psychol., vol. 6, no. August, pp. 1–9, 2015.
[2] G. Navarrete, R. Correia, M. Sirota, M. Juanchich, and D. Huepe, “Doctor, what does my positive test mean? From Bayesian textbook tasks to personalized risk communication,” Front. Psychol., vol. 6, no. 1327, pp. 1–6, 2015.
[3] G. Gigerenzer, U. Hoffrage, B. A. Mellers, and A. P. McGraw, “How to Improve Bayesian Reasoning Without Instruction: Frequency Formats,” Psychol. Rev., vol. 102, no. 4, pp. 684–704, 1995.
Recommended readings
[4] L. Micallef, P. Dragicevic, and J. D. Fekete, “Assessing the effect of visualizations on bayesian reasoning through crowdsourcing,” IEEE Trans. Vis. Comput. Graph., vol. 18, no. 12, pp. 2536–2545, 2012.
[5] A. Ottley, E. M. Peck, L. T. Harrison, D. Afergan, C. Ziemkiewicz, H. A. Taylor, P. K. J. Han, and R. Chang, “Improving Bayesian Reasoning: The Effects of Phrasing, Visualization, and Spatial Ability,” IEEE Trans. Vis. Comput. Graph., vol. 22, no. 1, pp. 529–538, 2016.
[6] R. Garcia-Retamero, E. T. Cokely, and U. Hoffrage, “Visual aids improve diagnostic inferences and metacognitive judgment calibration,” Front. Psychol., vol. 6, no. July, p. 932, 2015.
[7] A. Cairo, “Research on persuasive visualization and risk communication,” 2016. http://www.thefunctionalart.com/2016/01/research-on-persuasive-visualization.html
[8] “Improving Bayesian Reasoning: What Works and Why?” http://journal.frontiersin.org/researchtopic/2963/improving-bayesian-reasoning-what-works-and-why.
[9] D. Spiegelhalter, M. Pearson, and I. Short, “Visualizing Uncertainty About the Future,” Science (80-. )., vol. 333, no. 6048, pp. 1393–1400, Sep. 2011.
[10] A. Khan, S. Breslav, M. Glueck, and K. Hornbæk, “Benefits of visualization in the Mammography Problem,” Int. J. Hum. Comput. Stud., vol. 83, pp. 94–113, 2015.
Contest Submissions
Mammography
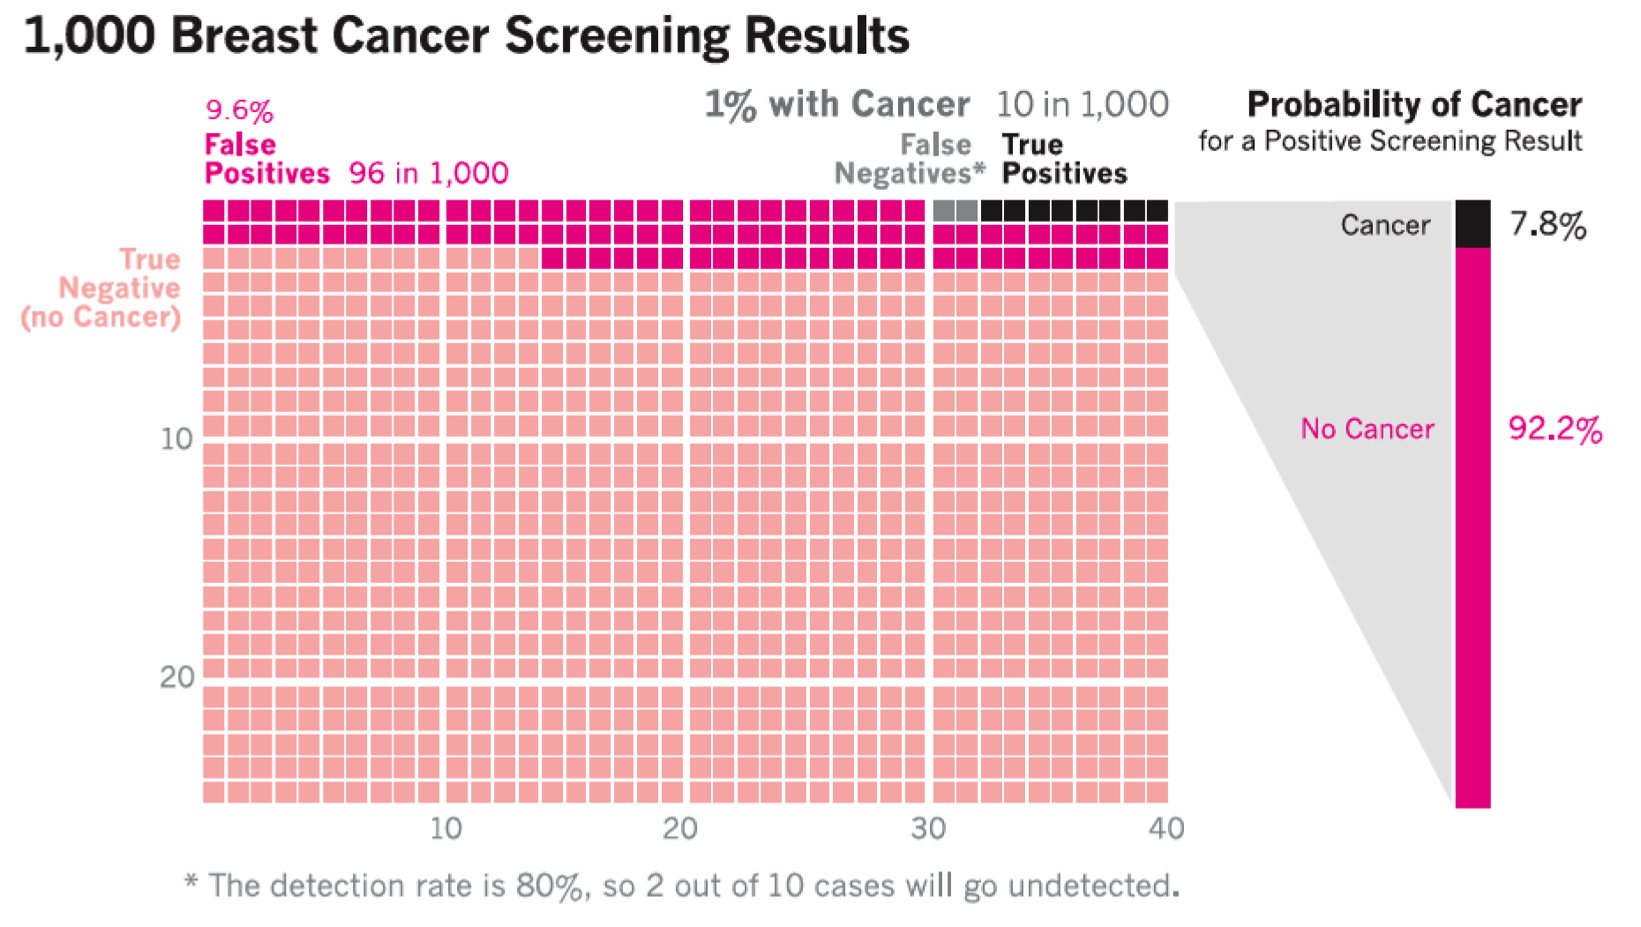
Scenario Text: “The probability of breast cancer is 1% for a woman who participates in routine screening. If a woman who participates in routine screening has breast cancer, the probability is 80% that she will have a positive test result. If a woman who participates in routine screening does not have breast cancer, the probability is 9.6% that she will have a positive test result.” [1, 3]
Target Question: “What is the probability that a woman who participates in routine screening and receives a positive result has breast cancer?” [1]
Answer: 7.8%
Accepted Submission
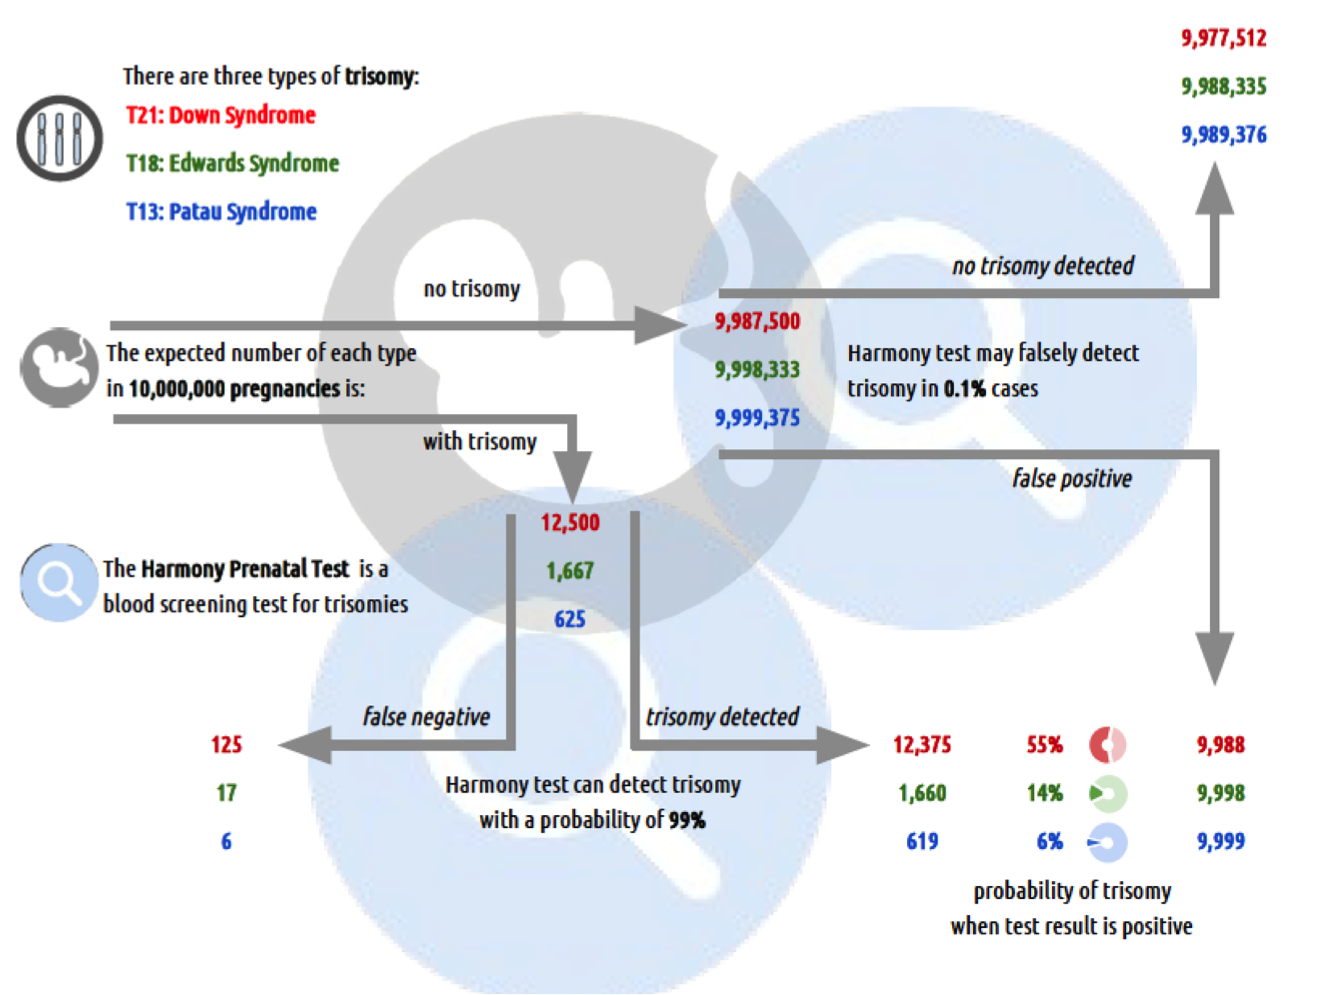
Down Syndrome
Scenario Text: “It is estimated that trisomy 21 is present in 1 out of every 800 births in Canada. It is estimated that trisomy 18 is present in approximately in 1 out of every 6,000 births. It is estimated that trisomy 13 is present in approximately in 1 out of every 16,000 newborns. The Harmony Test has been shown to have detection rates of up to 99% and false positive rates as low as 0.1% for trisomy 21, 18, and 13.”
Target Question: What are the probabilities of having a child affected with a trisomy 21, 18, or 13 given a positive test result, respectively?
Answer:55%, 14%, and 6%
Accepted Submission