Posters BioVis@VIS
Attended BioVis@VIS 2016? Please fill out our survey and tell us what you thought!
|
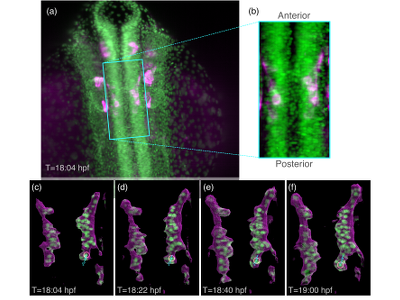
Poster: Visualizing the Trajectories and Contexts of Facial Branchiomotor Neuron Pioneers
Tri Huynh, Anastasia Beiriger, Victoria Prince, Gordon Kindlmann
A crucial part of nervous system development in vertebrate embryos is migration of neurons from initial birth-place to final destinations within the brain. The migration trajectories are fundamental to proper brain wiring. Recently we showed that within the neurons of the facial nerve, a single "pioneer" neuron guides movement of the remaining neurons. Basic questions remain: Where do pioneer neurons come from, how do they know where to go, and how do other neurons know how to follow them? We are studying the pioneer neurons that lead facial branchiomotor neurons (FBMNs) of zebrafish embryos via light-sheet microscopy imaging. Technical and scientific challenges drive our visualization research. Imaging one embryo (over about 8 hours) generates a terabyte of two-channel image data (GFP for nuclei, RFP for cell membranes). The data size and the ventral location of the FBMN (limiting image quality) impede simple application of existing automated cell trackers. The two FBMN pioneers can be identified by an expert near the end of the experiment, but must then be tracked back in time and position to their birth. Empowering and augmenting this expert analysis is a novel visualization design challenge. Answering the driving scientific questions will require new ways to visually summarize recovered pioneer trajectories and their cellular context over space and time, to identify the factors determining their structure. In work to date, we developed visualizations of time-steps with annotated pioneer locations, and are now developing interfaces to select and display a time-step for a particular point along the trajectory. |
|
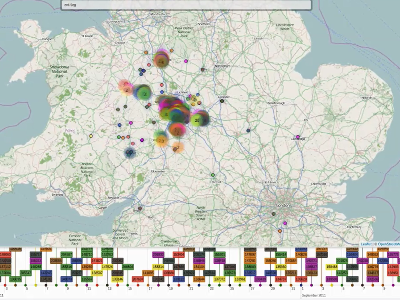
Poster: Co-visualisation of Close Genetic Relatedness of Mycobacterium Tuberculosis Isolates with Complex Meta-Data
Trien V. Do, Oriol Mazariegos Canellas, Derrick Crook, Tim Peto, David Wyllie
Routine DNA sequencing of all Mycobacterium tuberculosis samples isolated in England is projected to be operational within the next 12 months. We have recently created a web application which allows identification of closely genetically related samples and storage of meta-data about the individuals from whom they were obtained. This capability is of interest since breaking chains of transmission depends on their rapid identification and pairs of individuals with highly related samples are more likely to have transmitted to each other. However, prioritising interventions requires expert review of the genetic relationships, intervals between isolation, location, and individual risk factors, inter alia. This paper presents a visualisation approach to address this issue. A user (e.g. a public health doctor, or TB control nurse) logs into the web application then can select sets of individuals of interest, either by date, name, specimen number, or genetic relatedness to all cases. In 'set of samples' mode, the application allows residential addresses, times of isolation, and genetic relationships to be co-visualised for a sample set in a map view and a timeline. In 'single case exploration' mode, links between a single case and others can be displayed, with metadata displayed in tooltip like format (e.g. name, age, address, history, resistance, contact number). The user can 'Explore from here', upon which the current sample will become a new target sample. Thus, iterative exploration of transmission networks is possible. This application is being co-developed and evaluated between the University of Oxford and Public Health England TB control professionals. |
|
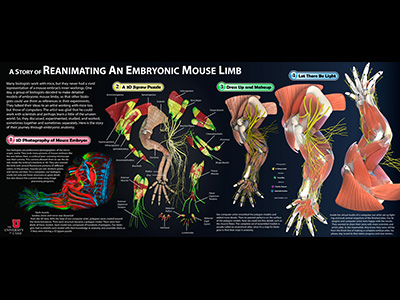
Poster: A Story of Reanimating an Embryonic Mouse Limb
Yong Wan, A. Kelsey Lewis, Gabrielle Kardon, Charles Hansen
People's impression of a mouse embryo seems to stay with a tiny and gummy-bear-like creature. In fact, mouse embryos have complicated anatomy. They have similar structures to their adults, but differences do exist. Mouse embryos are also invaluable models for biologists, who need a detailed map of their anatomy. Unfortunately, there was no such map (or atlas) that features the details and beauty often seen in those of human anatomy. If making a finely detailed atlas of mouse embryos is unprecedented, presenting both the result and workflow at the same time is more challenging. This poster is an attempt at the challenge, or at least part of it, quite literally ' the making of the anatomical atlas of an embryonic mouse limb. The poster presents the evolving process of an embryonic mouse limb atlas. Finely detailed structures are seen in the confocal photograph, the intermediate models and the final renderings. This is the first time that detailed structures of an embryonic mouse limb are imaged and modeled. It is also the first time that artist's tools are used in building embryo atlases in scientific research. It shows us the effectiveness of an artist's workflow and tools in solving a scientific problem. Advanced techniques in computer graphics are used to generate renderings of the volumetric data from confocal microscopy and the polygonal data of the atlas. Stories like this are always inspirational to both scientists and artists. We hope that this work prompts interdisciplinary collaborations and greater achievements can be made. |
|
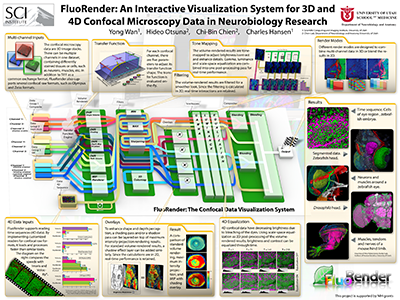
Poster: FluoRender: An Interactive Visualization System for 3D and 4D Confocal Microscopy Data in Neurobiology Research
Yong Wan, Hideo Otsuna, Chi-Bin Chien, Charles Hansen
FluoRender is an interactive tool for neurobiologists to visualize confocal microscopy data in their research. Multiple channels, detailed three-dimensional structures, and time-dependent sequences are the three major features of confocal microscopy data. With these features and usability in mind, we designed and engineered our system, which is now a free package for public download. We present the visualization pipeline and main features of our system for 3D/4D multi-channel confocal data visualization. Our system supports different input formats commonly seen for confocal microscopy. By minimizing pre-processing and optimizing data reading codes, it can read 3D/4D data with minimal latency. It has easy-to-use parameters for volume rendering effects, which are adjusted with real-time speed. It uses several image post-processing methods for detail enhancement, which are applied after volumetric data are rendered, and thus their adjustments are real-time even for 4D sequences. For multi-channel data, our system supports three different blending modes and channel grouping. Users can easily change all the settings and emphasize the most important features. Our presentation also includes several result images generated by our collaborating biologists. |
|
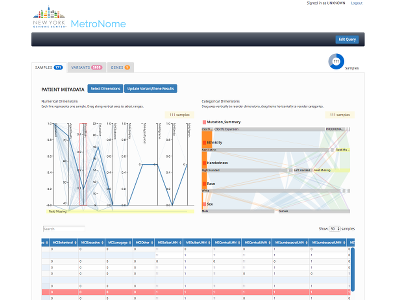
Poster: MetroNome: Visual Data Exploration for a Genomic Data Repository
Christian Stolte, Dorian Leary, Dimitrije Jeremovic, Kevin Shi, Sudeep Mehrotra, Nina Lapchyk, Avinash Abhyankar, Ann-Katrin Emde, Shailu Gareya, Toby Bloom
In recent years the cost of genomic sequencing has dropped to a level that allows hospitals to make it a routine procedure. But science still has much to learn before doctors can use a patient's genome as a diagnostic aid, or select a treatment based on genotype. The big gap in knowledge is the connection between genotypes and phenotypes. Besides disease-specific resources, such as The Cancer Genome Atlas (TCGA), and reference data from healthy populations (think 1,000 Genomes Project), researchers need databases that allow them to connect everyday electronic health records with genomic information. MetroNome is a data warehouse that brings all these resources together. It has a web-based exploratory interface to correlate genotypes with phenotypes. The system accepts genomic sequence and clinical data from any research project. Participating researchers can explore their data in an interactive visual interface and organize data along many dimensions. We visualize genomic variants in three different contexts: 1. per chromosome, in a sample frequency histogram; 2. per gene, mapping variants and their frequency onto a gene diagram displaying both genomic sequence and the resulting protein transcript; 3. in a sample/gene matrix, showing 5 dimensions per variant. For clinical data, we chose parallel coordinate and parallel set diagrams to display numerical and categorical dimensions. Both can show many dimensions at once and allow users to spot trends and correlations. These diagrams also function as selection tools to hone in on sample sets or genomic regions with specific attributes. |
|
Poster: Visual Analysis System for Clustering Dementia Patients Based on Similarity of Dementia Phase Changing pattern
Mubashar Karim Raja, Youngbeom Choi, Wooseok Song, Kyungwon Lee
In this study we introduce a visual analysis system to facilitate the decision making system while diagnosing dementia patients. Our approach first applies the bar graph to visualize patients result records at each visit independently. These result records are the variables used when examining patients with dementia, obtained from CREDOS (Clinical Research Center for Dementia of South Korea). We then apply cluster analysis to visualize patient clusters dynamics over time based on their similarity of phase changing pattern. This allows user to identify patients' clusters and their phase changing patterns, inspect and compare findings and test variables between different patient clusters. The result records compiled include data for each patient at five discrete time points. Bar graph visualization has five discrete time point scores that help the user to analyze the progress of patients. User can select the variable from the drop down menu, which seems more important to user. Our work allows users to see multi-level clustering at one sight. There are so many test results, which need to be studied closely in order to diagnose which phase of dementia a patient has. Although the outset of dementia cannot be stopped or reversed, but if it is diagnosed at early stage it allow people with dementia a better chance of benefiting from treatment. For this reason, early detection is highly important for patients. It is however difficult to provide details on the patient's status via current diagnosis indicators, since it is rather widely categorized as Alzheimer disease, vascular dementia. |
|
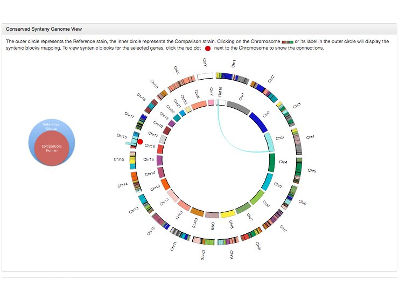
Poster: The JAX Synteny Browser for Mouse-Human Comparative Genomics
Mei Xiao, Keith Sheppard, Paul Hale, Govindarajan Kunde-Ramamoorthy, Joel Richardson, Carol Bult
Conserved synteny is a description for when gene content and order of a region of an organism's genome is conserved in the genome of a different species. Visualizing and navigating between shared syntenic blocks is a common task for comparative genetics. For example, researchers may wish to start with the genome location of a trait mapped in a GWAS study to the corresponding genome location in mouse as part of a strategy to identify candidate genome features for the human trait. Although many visualization tools have been developed for navigating conserved syntenic regions, existing tools are limited to visualization of the genome features and do not support interactions with the annotations of genome features displayed. To address this usability gap, we have developed a new interactive web-based synteny browser. The JAX Synteny Browser includes support for searching for and displaying genome features according to their biological annotations. The tool has been implemented for mouse and human but the design is intentionally generic and can be applied to any two genomes. Using this browser, users can launch navigation from a user-selected reference genome using genome coordinates or results of searches for mapped features of interest. Once a genome region has been selected, users can view the features that are annotated in specific syntenic blocks and adjust the display of the features based on their annotations. Combining visualization with genome feature interaction makes this tool unique among the currently available options for visualization of conserved synteny. Supported in part by: U41 HG000330 |