Program for BioVis@Vis Workshop
BioVis@Vis 2020 Challenges Workshop Program
When: Monday October 26th, 2020, 8:00 - 11:30 AM (Mountain Time, UTC-7)
Location: Online (for further details see the http://ieeevis.org/)
8:00 - 8:05
Opening remarks
8:05 - 9:30
Domain Expert Presentations
8:05 - 8:30
Talk Title TBD
Speaker: David Aanensen , Oxford Big Data Institute ... [abstract & bio]
8:30 - 8:55
Phylogenetic trees: a technically true data-vis disaster
Speaker: Gytis Dudas, Freelance Consultant ... [abstract & bio]
8:55 - 9:25
How does the average biologist find meaning in their (large, messy, and nuanced) data?
Speaker: Sidney Bell, Chan Zuckerberg Initiative ... [abstract & bio]
9:30 - 10:00
Coffee Break
10:00 - 10:50
Data and Redesign Challenge Results
Click on titles to see submissions for the data and redesign challenges
10:00 - 10:30
Interactive visualization of molecular and health data in large families at high risk for suicide death
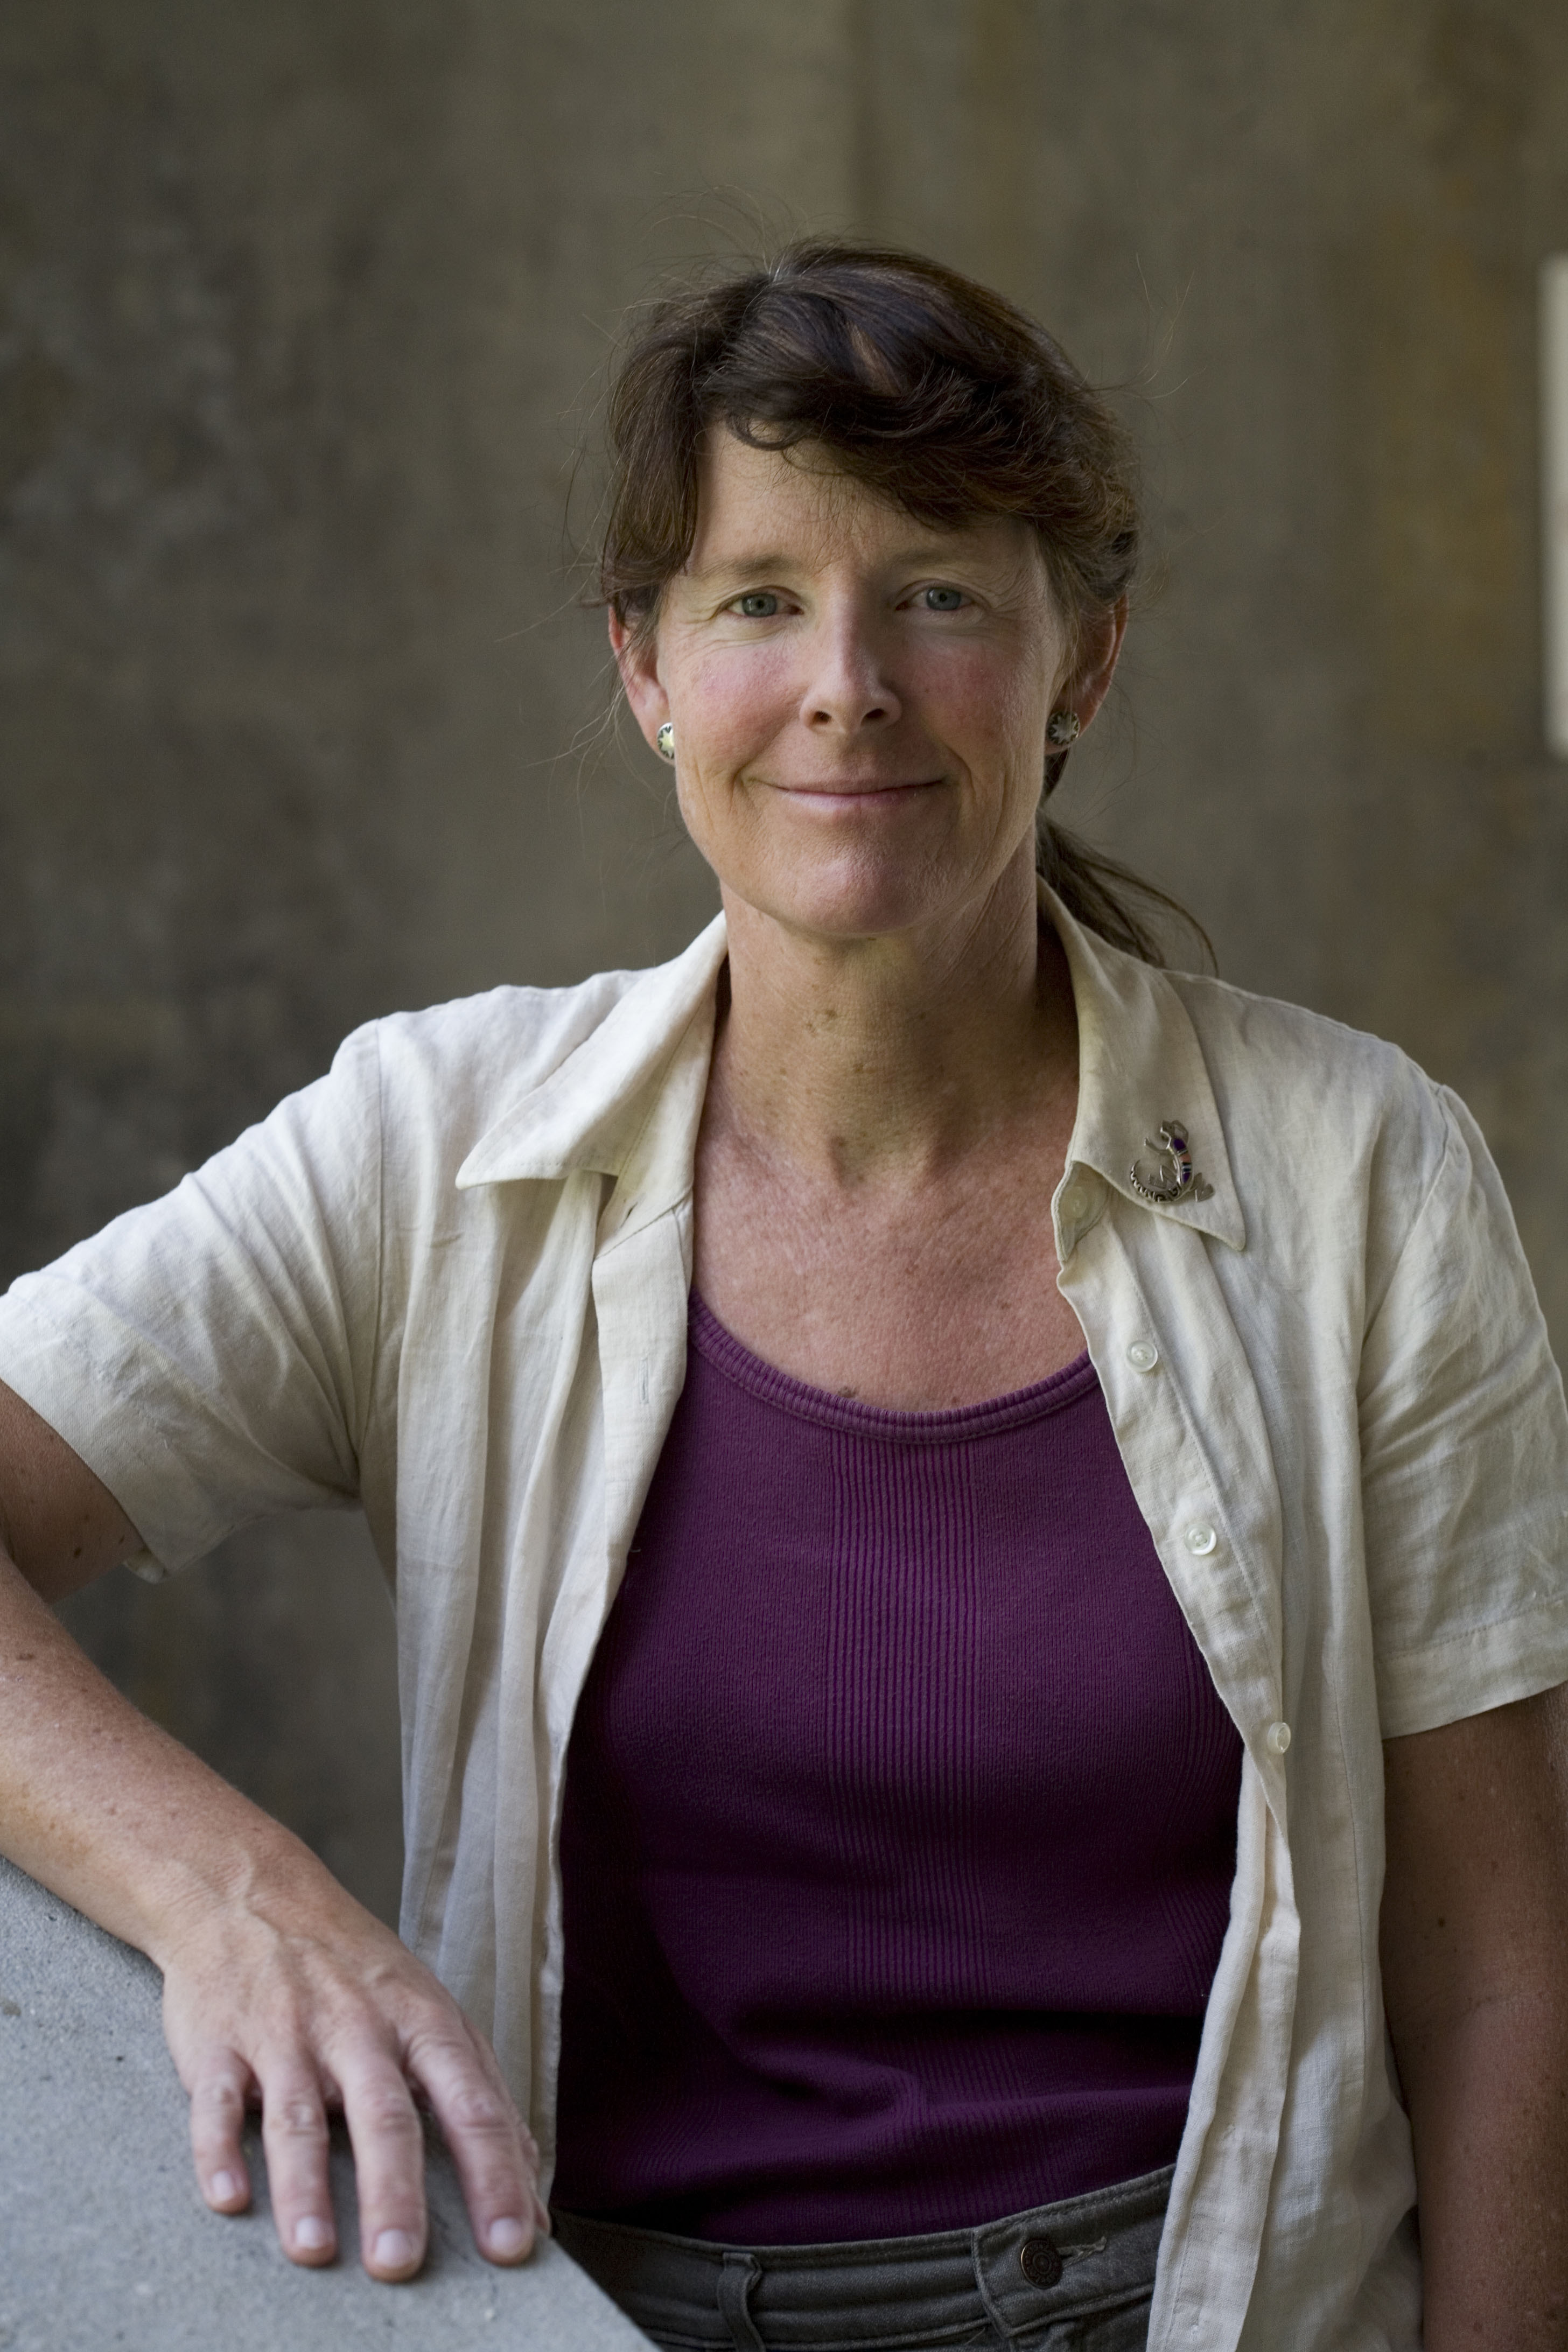
Speaker: Hilary Coon, University of Utah School of Medicine ... [abstract & bio]
10:30 - 10:35
Presenter: Mingi Ryu
10:35 - 10:40
Presenter: Jake Gonzalez
10:40 - 10:45
Presenter: Michael Aupetit
10:45 - 10:50
Presenter: Romain Vuillemot
10:55 - 11:30
Data Challenge Speaker
Interactive visualization of molecular and health data in large families at high risk for suicide death
Hilary Coon, University of Utah School of Medicine

Abstract:
Talk Abstract TBD
Speaker Bio:
Dr. Coon received her training in genetics and statistical methods from the Institute for Behavioral Genetics at the University of Colorado. Her work now focuses on study of risks for suicide. This work is made possible through a collection of over 7000 DNA samples from suicide deaths collected through a two-decade collaboration with the Utah State Office of the Medical Examiner. These cases have been linked to the Utah Population Database (UPDB), a statewide data resource that includes extensive genealogical records, demographics, environmental data, and current medical data from >11 million individuals. Dr. Coon’s studies focus on identifying and characterizing individuals at highest risk, with the goal of developing individualized interventions. This work involves multiple methods, including the study of familial genetic variants in very extended high-risk families, genome-wide association studies and polygenic risk characterization, studies to elucidate genes and gene pathways using whole exome sequence (WGS) data, integration of molecular data and data from health records to determine risk subgroups using machine learning methods, and studies to identify modifiable environmental exposure risks.
Domain Expert Presentations
Expert panelists will discuss the data analysis and visualization challenges in their specific areas. Each panelist will deliver a short presentation, after which audience members will have an opportunity to further discuss with them about their specific challenges and existing solutions.Talk Title TBD
David Aanensen, Oxford Big Data Institute

Abstract:
Talk Abstract TBD
Speaker Bio:
Dr. David Aanensen is the director of the centre for genomic pathogen surveillance at the Oxford Big Data Institue. Dr. Aanensen and team focus on data flow and the use of genome sequencing for surveillance of microbial pathogens through a combination of web application and software engineering, methods development and large-scale structured pathogen surveys and sequencing of microbes with delivery of information for decision making. Working with major public health agencies such as the US CDC, the European CDC, Public Health England and the WHO, systems are utilised to interpret and aid decision making for infection control.
Dr. Aanensen is also Director of the NIHR funded Global Health Research Unit on Genomic Surveillance of Antimicrobial Resistance working with partners leading National AMR strategies in The Phillipines, Colombia, Nigeria and India to implement genomic surveillance and linking to routine phenotypic and epidemiological data for priority pathogens.
Major Applications include:
Epicollect5 - Mobile data gathering platform used globally and by major health agencies, citizen scientists, ecologists, epidemiologists, business analytics, schools and colleges (..largely initiatives outside of the initial use cases..) over 14,000 projects and > 28Million data points.
Microreact - Open data visualisation and sharing for genomic epidemiology. Used by major agencies such as CDC, eCDC and PHE for routine investigation of public health incidents.
Pathogenwatch - A global platform for genomic surveillance of microbial pathogens (including all major WHO Priority bacterial pathogens) Rapid prediction of resistant genotypes, and clustering giving epidemiological context.
Phylogenetic trees: a technically true data-vis disaster
Gytis Dudas, Freelance Consultant

Abstract:
Talk Abstract TBD
Speaker Bio:
Dr. Gytis Dudas is a Lithuanian evolutionary biologist/genomic epidemiologist currently working as an independent contractor in Gothenburg, Sweden. Gytis' research covers a variety of evolutionary topics concerning viruses, for example his most recent project involved discovering new viruses in Californian mosquitoes in collaboration with colleagues from Chan Zuckerberg Biohub. Most of Gytis' research to date, however, has focused on understanding the patterns of human virus transmission using the genetic material of viruses themselves. Beginning with his PhD at the University of Edinburgh in Prof. Andrew Rambaut's lab and continuing during a postdoc in Dr. Trevor Bedford's group at Fred Hutchinson Cancer Research Centre in Seattle Gytis has worked on Ebola virus during the 2013-2015 West African epidemic, Zika virus circulating locally in Florida during the summer of 2015, and MERS coronavirus in Saudi Arabia. The desire to clearly communicate research findings has inevitably led Gytis to concentrate heavily on data visualisation. One of his contributions to the niche field of genetic epidemiology is referred to by his colleagues as "the Ebola animation" which won the 2018 John Hunter Excellence in Plotting Prize and depicts the entirety of the West African Ebola virus epidemic from the virus' perspective.
How does the average biologist find meaning in their (large, messy, and nuanced) data?
Sideny Bell, Chan Zuckerberg Initiative

Abstract:
Talk Abstract TBD
Speaker Bio:
Dr. Bell works to empower researchers to explore and understand their data through capacity building and the development of open-source tools. Her past visualization projects include work on Cellxgene, an interactive explorer for high-dimensional data, and Nextstrain, an open global platform for tracking pathogen evolution in real-time. She is currently a Computational Biologist with the Chan Zuckerberg Initiative, working to help epidemiologists use viral genomic data to augment contact tracing.
Capstone
Talk Title TBD
Nils Gehlenborg, Harvard Medical School Dept of Biomedical Informatics

Abstract:
Talk Abstract TBD
Speaker Bio:
Nils Gehlenborg received his PhD from the University of Cambridge and was a predoctoral fellow at the European Bioinformatics Institute (EMBL-EBI).
The goal of Gehlenborg’s research is to improve human health by developing computational techniques and interfaces that enable scientists and clinicians to efficiently interact with biomedical data. Tight integration of algorithmic approaches from biomedical informatics with advanced data visualization techniques is central to his efforts, as is close collaboration with clinicians and experimentalists. Currently, Gehlenborg is researching and developing novel tools to visualize heterogeneous data from large-scale cancer genomics studies such as The Cancer Genome Atlas, integrating visual and computational approaches to support sense-making in biology, and using software to support reproducible collaborative research in epigenomics and genomics.
Gehlenborg is a co-founder and former general chair of BioVis, the Symposium on Biological Data Visualization, and co-founder of VIZBI, the annual workshop on Visualizing Biological Data. Occasionally, he contributes to the “Points of View” data visualization column in Nature Methods.
Gehlenborg currently serves as the Director of the Master of Biomedical Informatics (MBI) program at Harvard Medical School.