Program BioVis@ISMB
BioVis@ISMB 2020 Program
July 15, 2020
Invited Speakers
Visualization and Human-AI collaboration for biomedical tasks
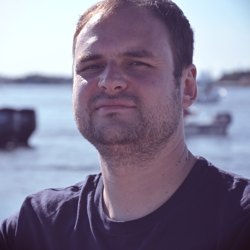
Hendrik Stobelt, IBM Research & MIT

Bio:
Hendrik Strobelt is the Explainability Lead at the MIT-IBM Watson AI Lab and Research Scientist at IBM Research. His recent research is on visualization for and human collaboration with AI models to foster explainability and intuition. The majority of his work is for NLP models and generative models while he is advocating to utilize a mix of data modalities to solve real-world problems. His work is applied to tasks in machine learning, in NLP, in the biomedical domain, and chemistry. Hendrik joined IBM in 2017 after postdoctoral positions at Harvard SEAS and NYU Tandon. He received a Ph.D. (Dr. rer. nat.) from the University of Konstanz in computer science (Visualization) and holds an MSc (Diplom) in computer science from TU Dresden. He received multiple best paper/honorable mention awards at EuroVis, BioVis, VAST, and ACL Demo. He received the Lohrmann medal from TU Dresden as the highest student honor. Hendrik has served in program committees and organization committees for IEEE VIS, BioVis, EuroVis. He was the virtual chair for ICLR 2020. Hendrik is affiliated as visiting researcher with MIT CSAIL.
Machine Learning for Drug Repurposing
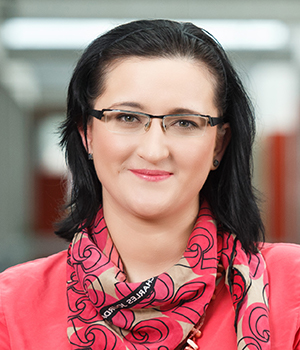
Marinka Zitnik, Harvard Medical School

Bio:
Marinka Zitnik is an Assistant Professor of Biomedical Informatics at Harvard Medical School. She is a computer scientist studying applied machine learning with a focus on challenges brought forward by data in science, medicine, and health. Dr. Zitnik joined Harvard Medical School in December 2019. Before that, she was a postdoctoral scholar in Computer Science at Stanford University working with Jure Leskovec. She was also a member of the Chan Zuckerberg Biohub at Stanford. She received Ph.D. in Computer Science from University of Ljubljana in 2015 while also researching at Imperial College London, University of Toronto, Baylor College of Medicine, and Stanford University. She received my bachelor’s degree in 2012 double majoring in computer science and mathematics. Her algorithms and methods have had a tangible impact, which has garnered interests of government, academic, and industry researchers and has put new tools in the hands of practitioners. Some of her methods are used by major biomedical institutions, including Baylor College of Medicine, Karolinska Institute, Stanford Medical School, and Massachusetts General Hospital. Her work received several best paper, poster, and research awards from the International Society for Computational Biology. She has recently been named a Rising Star in EECS by MIT and also a Next Generation in Biomedicine by The Broad Institute of Harvard and MIT, being the only young scientist who received such recognition in both EECS and Biomedicine.
Program
Please note that all the times listed here are in Eastern Daylight Time.
7:45 - 9:15
Poster Viewing
7:45 - 9:15
See the list of posters below
10:40 - 11:40
BioVis Opening & Keynote
Chair: Cagatay Turkay
10:40 - 10:50
BioVis Opening
10:50 - 11:40
Visualization and Human-AI collaboration for biomedical tasks
Speaker: Hendrik Strobelt
11:40 - 12:00
Break
12:00 - 12:40
Single Cell/High Dimensional Data
Chair: Jan Aerts
12:00 - 12:10
bio_embeddings: python pipeline for fast visualization of protein features extracted by language models
Authors: Christian Dallago, Michael Heinzinger, Tobias Olenyi, Ahmed Elnaggar and Burkhard Rost
12:10 - 12:20
Grid-Constrained Dimensionality-Reduction for Single-Cell RNA-Seq Summarization
Authors: Jon Hill and Di Feng
12:20 - 12:30
RNA-Scoop: interactive visualization of isoforms in single-cell transcriptomes
Authors: Maria Stephenson, Ka Ming Nip, Saber Hafezqorani, Chen Yang, René Warren and İnanç Birol
12:30 - 12:40
ImaCytE: Visual Exploration of Cellular Micro-environments for Imaging Mass Cytometry Data
Authors: Antonios Somarakis, Vincent van Unen, Frits Koning, Boudewijn Lelieveldt and Thomas Höllt
12:40 - 14:00
Break
14:00 - 15:00
BioVis Keynote
Chair: Kay Nieselt
14:00 - 15:00
Machine Learning for Drug Repurposing
Speaker: Marinka Zitnik
15:00 - 15:20
Break
15:20 - 16:40
Spatial Data
Chair: Michael Krone
15:20 - 15:40
Interactive visualization and analysis of morphological skeletons of brain vasculature networks with VessMorphoVis
Authors: Marwan Abdellah, Nadir Román Guerrero, Samule Lapere, Jay S. Coggan, Benoit Coste, Snigdha Dagaer, Daniel Keller, Jean-Denis Courcol, Henry Markram and Felix Schurmann
15:40 - 15:50
Multi-Scale Procedural Animations of Microtubule Dynamics Based on Measured Data
Authors: Tobias Klein, Ivan Viola, M. Eduard Gröller and Peter Mindek
15:50 - 16:00
Towards an Immersive Analytics Application for Anatomical Fish Brain Data
Authors: Dimitar Garkov, Etienne Lein, Christian Dullin, Karsten Klein, Alex Jordan, Falk Schreiber and Bjorn Sommer
16:00 - 16:20
ClonArch: Visualizing the Spatial Clonal Architecture of Tumors
Authors: Jiaqi Wu and Mohammed El-Kebir
16:20 - 16:30
A Web-based Framework for the Exploration of Heterogeneous Spatial Big Brain Data
Authors: Florian Ganglberger, Joanna Kaczanowska, Wulf Haubensak and Katja Bühler
16:30 - 16:40
PhenoPlot-v2 a flexible tool for visualising microscopy data
Authors: Heba Sailem
16:40 - 17:00
Break
17:00 - 18:00
Genomic & Network Data
Chair: Thomas Höllt
17:00 - 17:10
Grammar-Based Interactive Genome Visualization
Authors: Kari Lavikka, Jaana Oikkonen, Rainer Lehtonen, Johanna Hynninen, Sakari Hietanen and Sampsa Hautaniemi
17:10 - 17:20
Metabopolis: scalable network layout for biological pathway diagrams in urban map style
Authors: Hsiang-Yun Wu, Martin Nöllenburg, Filipa L. Sousa and Ivan Viola
17:20 - 17:30
Pantograph - Scalable Interactive Graph Genome Visualization
Authors: Josiah Seaman, Simon Heumos and Eric Garrison
17:30 - 17:40
A framework for the analysis, visualization, and comparison of multiple multi-omics networks
Authors: Anthony Federico and Stefano Monti
17:40 - 17:50
ProNetView-ccRCC: A web-based portal to interactively explore clear cell renal cell carcinoma proteogenomics networks
Authors: Selim Kalayci, Francesca Petralia, Pei Wang and Zeynep Gümüş
17:50 - 18:00
Interactive Visual Pattern Search in Epigenomic Data
Authors: Fritz Lekschas, Brant Peterson, Eric Ma, Nils Gehlenborg, and Hanspeter Pfister
18:00 - 18:15
Closing Session
Chair: Cagatay Turkay
18:00 - 18:15
Closing Remarks
Accepted Posters
FlyMet: An online metabolomics atlas and user-friendly resource for Drosophila tissues
Authors: Karen McLuskey, Sue Ann Krause, Joe Wandy, Shireen Davies, Karl Burgess, Julian Dow and Rónán Daly
Scaling Visual Analytics of Clinical Event Sequence Data through Interactive State Identification
Authors: Qianwen Wang, Theresa Harbig, Sabrina Nusrat, Tali Mazor, Ethan Cerami and Nils Gehlenborg
Cistrome Explorer: Web-based Interactive Visualization Tool for Exploring Epigenomics Data with Associated Metadata
Authors: Sehi L'Yi, Mark Keller, Chen-Hao Chen, Xiaole Shirley Liu, Cliff Meyer and Nils Gehlenborg
Modular Visualization of Spatial Single-Cell Omics Data
Authors: Trevor Manz, Ilan Gold, Chuck McCallum, Mark Keller, Peter Kharchenko and Nils Gehlenborg
SwissBioPics – an interactive library of cell images for the visualization of subcellular location data
Authors: Philippe Le Mercier, Jerven Bolleman, Edouard de Castro, Parit Bansal, Elisabeth Gasteiger, Andrea Auchincloss, Emmanuel Boutet, Lionel Breuza, Cristina Casals Casas, Anne Estreicher, Marc Feuermann, Damien Lieberherr, Catherine Rivoire, Ivo Pedruzzi, Nicole Redaschi and Alan Bridge
bio_embeddings: python pipeline for fast visualization of protein features extracted by language models
Authors: Christian Dallago, Michael Heinzinger, Tobias Olenyi, Ahmed Elnaggar and Burkhard Rost
Grid-Constrained Dimensionality-Reduction for Single-Cell RNA-Seq Summarization
Authors: Jon Hill and Di Feng
RNA-Scoop: interactive visualization of isoforms in single-cell transcriptomes
Authors: Maria Stephenson, Ka Ming Nip, Saber Hafezqorani, Chen Yang, René Warren and İnanç Birol
ImaCytE: Visual Exploration of Cellular Micro-environments for Imaging Mass Cytometry Data
Authors: Antonios Somarakis, Vincent van Unen, Frits Koning, Boudewijn Lelieveldt and Thomas Höllt
Multi-Scale Procedural Animations of Microtubule Dynamics Based on Measured Data
Authors: Tobias Klein, Ivan Viola, M. Eduard Gröller and Peter Mindek
Towards an Immersive Analytics Application for Anatomical Fish Brain Data
Authors: Dimitar Garkov, Etienne Lein, Christian Dullin, Karsten Klein, Alex Jordan, Falk Schreiber and Bjorn Sommer
A Web-based Framework for the Exploration of Heterogeneous Spatial Big Brain Data
Authors: Florian Ganglberger, Joanna Kaczanowska, Wulf Haubensak and Katja Bühler
PhenoPlot-v2 a flexible tool for visualising microscopy data
Authors: Heba Sailem
Grammar-Based Interactive Genome Visualization
Authors: Kari Lavikka, Jaana Oikkonen, Rainer Lehtonen, Johanna Hynninen, Sakari Hietanen and Sampsa Hautaniemi
Metabopolis: scalable network layout for biological pathway diagrams in urban map style
Authors: Hsiang-Yun Wu, Martin Nöllenburg, Filipa L. Sousa and Ivan Viola
Pantograph - Scalable Interactive Graph Genome Visualization
Authors: Josiah Seaman, Simon Heumos and Eric Garrison
ProNetView-ccRCC: A web-based portal to interactively explore clear cell renal cell carcinoma proteogenomics networks
Authors: Selim Kalayci, Francesca Petralia, Pei Wang and Zeynep Gümüş