Visualizing Ensembles of Predicted RNA Structures and Their Base Pairing Probabilities
Poster
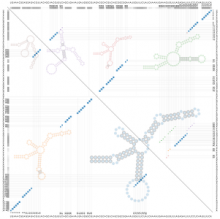
[Design Contest Entry] In this design contest submission we present an enhanced version of a traditional RNA dot plot containing a multitude of extra features and data, foremost among which is the inclusion of diagrams for the top Zuker sub-optimal RNA secondary structures. This new design facilitates and eases the interpretation of the dot plot by providing the viewer with an immediate representation of which structures the displayed base-pair probabilities belong to.