Visualizing ncRNA Structural Evolution with Arc Diagrams

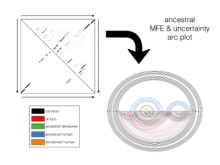
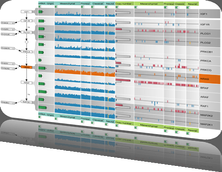
[Desing Contest Entry] The second challenge of this year’s BioVis Symposium Design Contest was to create a visualization of noncoding RNA (ncRNA) structural evolution of the human accelerated region 1 (HAR1) gene in ancestral, denisovan, and human sequences. The commonly used chart types for this data, dot plots and node-link style graphs, do not support direct comparison of base pairings among the three structures. We propose a redesign that uses arc diagram visualization techniques to highlight conserved or otherwise evolved base pairings. These diagrams support the placement of unique and prevalent base pairings along a common scale and allow mapping task-specific features to color, providing viewers with a more direct means to identify differences in the structure predictions.


