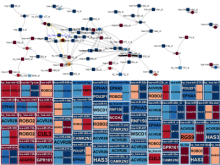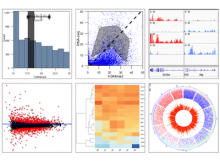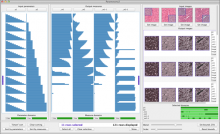
AnnoPeak: A visualization tool for Chip-Seq and Chip-Exo Analysis
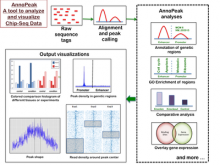
Chip-Seq and its improved resolution protocol Chip-Exo experiments, both describe location and strength of protein to DNA binding. These experiments are utilized in isolation as well as in a complementary fashion with microarray and RNA-Seq data to characterize binding events, and explore gene regulation and biological pathways. AnnoPeak aims to be a “one click”, simple to use, exploratory tool that efficiently generates sophisticated analyses of multiple experiments by annotating data with critical knowledge and utilizes a variety of different visualization techniques to characterize distinct experimental profiles. Current features include: binding peak’s genetic annotation, extraction of peaks from user selected regions, gene ontology enrichment of region specific binding, expedient linking to visualization of peaks on the UCSC genome browser, overlay of gene expression and alias, motif and ortholog based analyses. Primary visualizations constructed by AnnoPeak include histograms of peak density distribution, color coded and comparable representation of read depth around transcription start sites for multiple experiments, plots describing average peak shape, which can be readily normalized to compare binding profile in multiple experimental results, and graphs describing quality of replicates and data. Visual comparison of different experimental conditions by mapping colors to experiments and intensity gradients provides an easily interpretable summary of the data for downstream analysis. Since whole genome mapping using Chip-Seq is one of the most informative high throughput experiments in biology, a tool like AnnoPeak will provide a powerful utility for genetic exploration.
BioVis 2015 Information