BioTapestry: New development supports integrated visualization of computational results
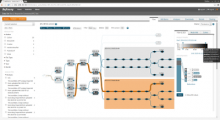
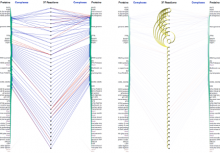
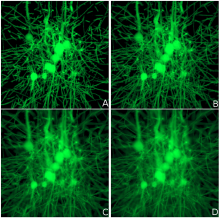
BioTapestry is a well-established tool for building, visualizing, and sharing models of gene regulatory networks (GRNs), with particular emphasis on the GRNs that drive development. BioTapestry features a hierarchical modeling framework that presents multiple views of the network at different levels of spatial and temporal resolution. This approach is well-suited to depicting the GRNs of an embryo that increases in spatial complexity over time. The most recent public release of BioTapestry, Version 7, can now be run as a web application which allows interactive, graphical GRN models to be viewed directly in a web browser. Researchers who wish to locally host an interactive GRN model can download and install the BioTapestry Web Application on a supported web server. Additionally, we are now hosting a set of published models of developmental GRNs on our new website, http://grns.BioTapestry.org/.
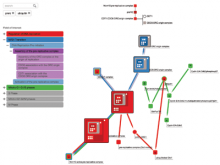
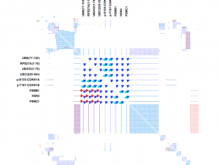
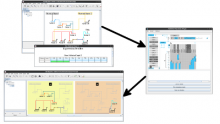
For the upcoming Version 8, we are creating a new plugin framework that allows computational modeling tools to be integrated into BioTapestry to drive dynamic network visualizations. Simple computational models with a limited number of generic parameters (e.g. Boolean models) can help guide the process of choosing and refining the GRN model that best describes observed data. This new framework will allow the user to visualize the results of simple computational modeling of GRN behaviors in a network context, including direct visual comparisons between experimental data and model predictions while viewing the network model.
BioVis 2015 Information