GRAPHIE: Graph based Histology Image Explorer
Background: Histology images comprise one of the important sources of knowledge for phenotyping studies in systems biology. However, the annotation and analyses of histological data have remained a manual, subjective and relatively low-throughput process.
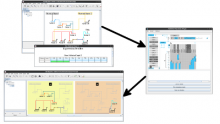
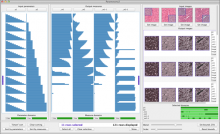
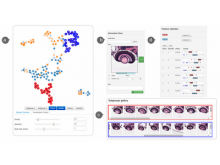
Results: We introduce Graph based Histology Image Explorer (GRAPHIE)–a visual analytics tool to explore, annotate and discover potential relationships in histology image collections within a biologically relevant context. The design of GRAPHIE is guided by domain experts' requirements and well-known InfoVis mantras. By representing each image with informative features and then subsequently visualizing the image collection with a graph, GRAPHIE allows users to effectively explore the image collection. The features were designed to capture localized morphological properties in the tissue specimen. More importantly, users can perform feature selection in an interactive way to improve the visualization and the annotation process. Finally, the annotation allows for a better prospective examination of the datasets as demonstrated in the users study. Thus, our design of GRAPHIE allows for the users to navigate and explore large collections of histology image datasets.
Conclusions: We demonstrated the usefulness of our visual analytics approach through two case studies. Both of the cases showed efficient annotation and analysis of histology image collection.
BioVis 2015 Information
