Interactive Visualization of Provenance Graphs for Reproducible Biomedical Research
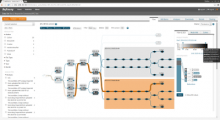
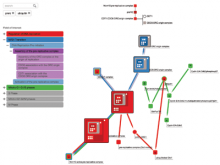
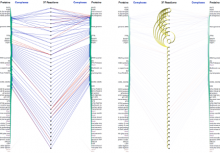
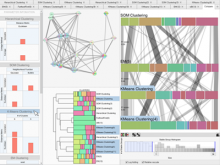
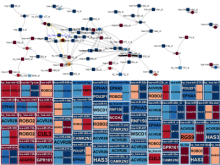
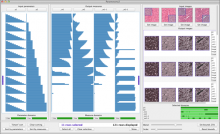
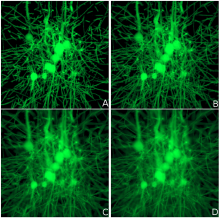
A major challenge of data-intensive biomedical research is the collection and representation of provenance information to ensure reproducibility of the studies. The Refinery Platform (http://www.refinery-platform.org) is an integrated data management, analysis, and visualization system designed to support reproducible biomedical research. Refinery stores each data set as a directed acyclic experiment graph that associates every file in the data set with meta data annotations as well as the analyses and input files that were used to create it. In order to communicate and reproduce multi-step analyses on data sets that contain data for hundreds of samples, it is crucial to be able to visualize the provenance graph at different levels of detail. Most existing approaches for provenance visualization are based on node-link diagrams, however, they usually do not scale well to due to the limitations of the this visualization approach. Our proposed visualization technique dynamically reduces the complexity of subgraphs through hierarchical aggregation and application of a degree-of-interest (DOI) function to each node. Triggered by user interactions such as filtering for a subset of analyses or highlighting of a path in the graph, subgraphs are dynamically aggregated into a glyph representation. We further reduce the complexity of the provenance graph visualization by layering identical or similar sequences of parallel analysis steps into an aggregate sequence. We have implemented our approach in Refinery and our initial results are very promising. Future work will focus on the fine-tuning of the DOI function and comphrehensive user testing.
BioVis 2015 Information