A Novel Tool for Isoform Visualization
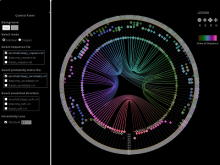
Protein isoforms can be assembled from the same DNA sequence by means of alternative splicing, which selectively omits some of the coding regions (exons) associated with a gene. Detecting alternative splicing requires advanced data acquisition methods such as RNA-seq, as well as dedicated statistical inference methods such as MISO, TopHat, and RSEM. Analyzing the abundance of the corresponding isoforms under different conditions is important to understand and differentiate between normal processes and diseases, which helps in developing targeted therapies for these diseases. The data required for such analysis is multi-faceted, involving the abundance of exon reads, evidence for junctions between the exons, and predictions of isoform frequencies. Furthermore, conducting a comparative analysis involves multiple samples having varying values for the above information. State-of-the-art isoform visualizations such as Sashimi plots, SpliceGrapher, and SplicingViewer are limited both in terms of perceptual efficiency and in terms of comparing data of multiple samples.
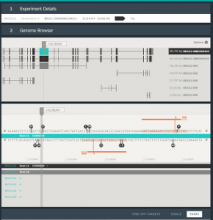
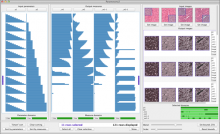
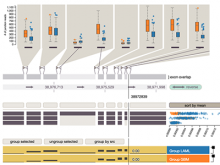
To address these limitations, we developed a novel analysis tool for multi-faceted isoform data, in collaboration with biologists. Our open-source tool, called Vials, consists of coordinated multiple views to represent each of the data facets using the most effective visual encoding. It allows a simultaneous exploration of a large number of samples, and a comparative analysis between multiple groups of these samples. Our collaborators used Vials to analyze isoform data from The Cancer Genome Atlas (TCGA) and Illumina BodyMap 2. An online version of Vials along with a video demonstration and example analysis scenarios are available at http://vcglab.org/vials/
BioVis 2015 Information