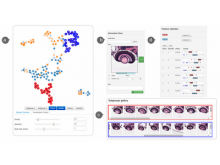
XCluSim: A visual analytics tool for interactively comparing multiple clustering results of bioinformatics data
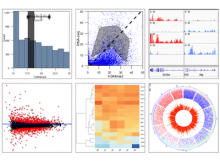
Background: Though cluster analysis has become a routine analytic task for bioinformatics research, it is still arduous for researchers to assess the quality of a clustering result. To select the best clustering method and its parameters for a dataset, researchers have to run multiple clustering algorithms and compare them. However, such a comparison task with multiple clustering results is cognitively demanding and laborious.
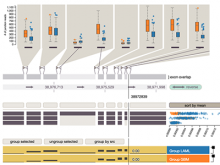
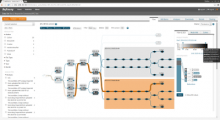
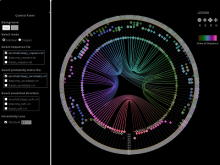
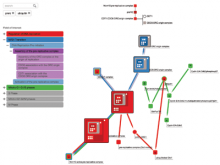
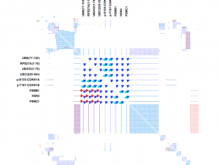
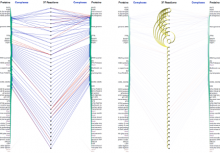
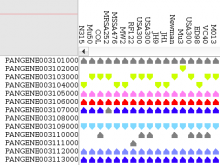
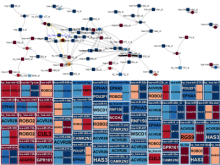
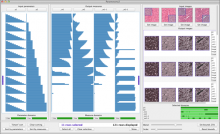
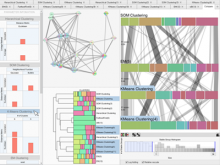
Results: In this paper, we present XCluSim, a visual analytics tool that enables users to interactively compare multiple clustering results based on the Visual Information Seeking Mantra. We build a taxonomy for categorizing existing techniques of clustering results visualization in terms of the Gestalt principles of grouping. Using the taxonomy, we choose the most appropriate interactive visualizations for presenting individual clustering results from different types of clustering algorithms. The efficacy of XCluSim is shown through case studies with a bioinformatician.
Conclusions: Compared to other relevant tools, XCluSim enables users to compare multiple clustering results in a more scalable manner. Moreover, XCluSim supports diverse clustering algorithms and dedicated visualizations and interactions for different types of clustering results, allowing more effective exploration of details on demand. Through case studies with a bioinformatics researcher, we received positive feedback on the functionalities of XCluSim, including its ability to help identify stably clustered items across multiple clustering results.
BioVis 2015 Information