ADVISe: Visualizing the dynamics of enzyme annotations in UniProt/SwissProt
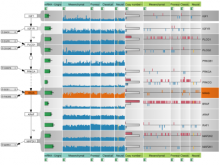
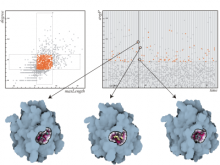
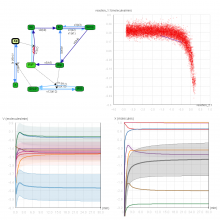
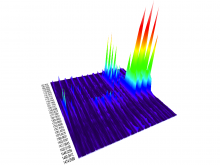
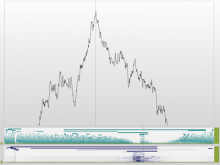
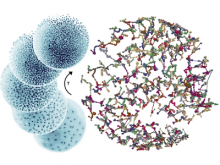
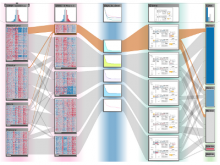
In this paper, we propose an interactive visualization called ADVISe (Annotation Dynamics Visualization), which tackles the problem of visualizing evolutions in enzyme annotations across several releases of the UniProt/SwissProt database. More specifically, we visualize the dynamics of Enzyme Commission numbers (EC numbers), which are a numerical and hierarchical classification scheme for enzymes based on the chemical reactions they catalyze. An EC number consists of four numbers separated by periods and represents a progressively finer classification of the catalyzed reaction. The proposed interactive visualization gives a macro view of the changes and presents further details on demand, such as frequencies of change types segmented by levels of generalization and specialization as well as by enzyme families. Users can also explore entry metadata. With this tool, we were able to identify trends of specialization, database growth and exceptions in which EC numbers were deleted, divided or created and revisions of past annotation errors.
BioVis 2012 Information
