Epithelial Cell Reconstruction and Visualization of the Developing Drosophila Wing Imaginal Disc
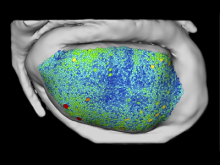
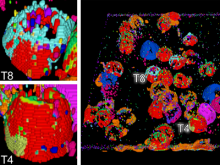
Quantifying and visualizing the shape of developing biological tissues provide information about the morphogenetic processes in multicellular organisms. The size and shape of biological tissues depend on the number, size, shape, and arrangement of the constituting cells. To better understand the mechanisms that guide tissues into their final shape, it is important to investigate and measure the cellular arrangements within tissues. Here we present a set of techniques that produces detailed 3D models of the individual cells in an epithelial sheet. The inputs to the techniques are a volumetric model of an epithelium and a mesh model of the cell boundaries lying on its apical surface. The techniques include: definition of a Region of Interest (ROI), projection of the ROI vertices first to the basal surface then to the apical surface, projection of apical cell faces to the basal surface, creation of 3D epithelial cell models, and calculation and visualization of length and volume for each cell. In their first utilization we have applied these techniques to construct the individual epithelial cells of the wing imaginal disc of Drosophila melanogaster. To date, 3D epithelial cell models have been created, allowing for the calculation and visualization of cell parameters. The results show position-dependent patterns of cell shape in the wing imaginal disc. Our procedures should offer a general data processing pipeline for the construction of detailed 3D models of a wide variety of epithelial tissues.
BioVis 2012 Information
