Gene-RiViT: A visualization tool for comparative analysis of gene neighborhoods in prokaryotes
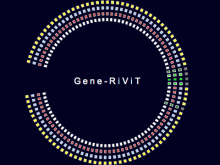
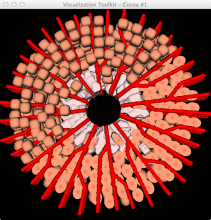
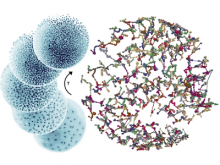
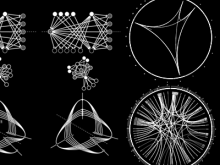
The genomes of prokaryotes are dynamic and shuffling of gene order \ occurs frequently, along with horizontal transfer of genes from \ external sources. Local conservation of gene order tends to reflect \ functional constraints on the genome or on a biochemical subsystem. \ Comparison of the local gene neighborhoods surrounding a \ gene of interest gives insight into evolutionary history and functional \ potential of the gene. The Genomic Ring Visualization Tool \ (Gene-RiViT) is a high speed, intuitive visualization tool for investigating \ sequence environments of conserved genes among related \ genomes. Gene-RiViT allows the user to interact with interconnected \ global and local visualizations of gene neighborhoods and \ gene order, through a web-based interface that is easily accessible \ in any browser. The primary visualization is a wheel of nested \ rotating circles, each of which represents a single genome. This visualization \ is similar to common circular genome alignment views, \ except that the rings can be realigned with each other dynamically \ based on user selections within the ring view or one of the coordinated \ views. By allowing the user to dynamically realign genomes \ and focus on a locally conserved region of interest, and using orthology \ connections to highlight corresponding structures among \ genomes, this view provides insight into gene context and preservation \ of neighbor relationships as genomes evolve. Visualizations \ are linked into a coordinated multiple view interface to provide \ multiple selection methods and entry points into the data. These \ approaches make Gene-RiViT a flexible, unique tool for examining \ gene neighborhoods that improves on existing methods.
BioVis 2012 Information
