Heterogeneity-based Guidance for Exploring Multiscale Data in Systems Biology
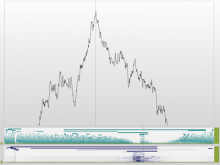
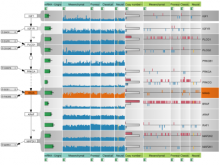
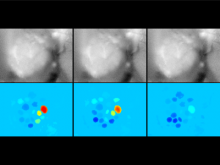
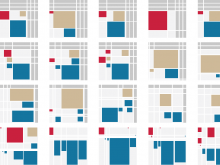
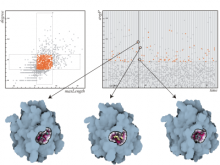
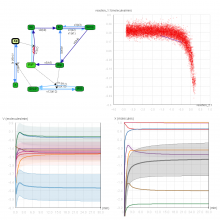
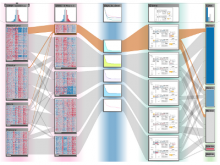
In systems biology, analyzing simulation trajectories at multiple scales is a common approach when subtle, detailed behavior and fundamental, overall behavior of a modeled system are to be investigated at the same time. A variety of multiscale visualization techniques provide solutions to handle and depict data at different scales. Yet the mere existence of multiple scales does not necessarily imply the existence of additional information on each of them: Data on a more fine-grained scale may not always yield new details, but instead reflect the already known data from more coarse-grained scales -- just at a higher resolution. Nevertheless, to be sure of this, all scales have to be explored. \ \ We address this issue by guiding the exploration of simulation trajectories according to information about the deviation of the data between subsequent scales. For this purpose, we apply different dissimilarity measures to the simulation data at subsequent scales to automatically discern heterogeneous regions that exhibit deviating behavior on more fine-grained scales. We mark these regions and display them alongside the actual data in a multiscale visualization. By doing so, our approach provides valuable visual cues on whether it is worthwhile to drill-down further into the multiscale data and if so, where additional information can be expected. Our approach is demonstrated by an exploratory walk-through of stochastic simulation results of a biochemical reaction network.
BioVis 2012 Information
